

Silver (XAG/USD) recorded its steepest weekly decline since the first week of May, shedding nearly 10% over the five‑day period. The selling climax came on Friday after the US May nonfarm payrolls report delivered a massive upside surprise, doubling the consensus forecast, crushing dovish expectations and sending the probability of a Federal Reserve rate hike by December surging past 67%.
Weekly Chart: A Brutal Bearish Engulfing Candle
The weekly candlestick for the June 1‑5 session is one of the most aggressive bearish signals silver has printed all year. The candle nearly engulfed the previous three weeks of price action, opening near $76.50 and closing just above $68.00 — a drop of more than 11% from the weekly high. This severe bearish engulfing pattern, accompanied by sharply rising volume, confirmed that institutional money managers were actively reducing their silver exposure ahead of the jobs data.
From a structural perspective, silver plunged straight through multiple support levels that had contained pullbacks since March. The 50‑week simple moving average near $74.50 was violated without a bounce, and the metal ended the week testing the 90‑period exponential moving average, which had not been reached since the post‑war consolidation began. More importantly, Friday’s settlement price marked the first weekly close below the 50‑week SMA in four months, a widely followed signal that the intermediate‑term trend has shifted from bullish to bearish.
Momentum on the weekly timeframe has completely collapsed. The Relative Strength Index (RSI), which had been holding above 55 just two weeks ago, plunged toward 42, exiting neutral territory and pointing decisively lower. The MACD lines crossed into bearish divergence for the first time since February. Volume expanded to the highest weekly level since the US‑Israel strikes on Iran in late February, confirming that the breakdown was fueled by genuine selling pressure rather than thin liquidity or algorithmic noise.
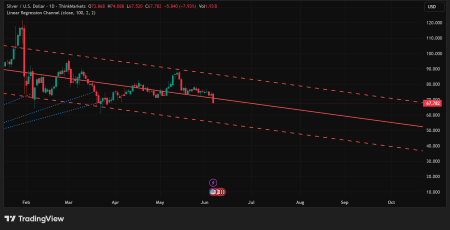
Daily Chart: Testing the 200‑Day SMA – A Critical Inflection Point
On the daily chart, silver’s breakdown was nothing short of spectacular. The metal collapsed from $74.50 early in the week to a session low of $68.03 on Friday before recovering slightly to close near $68.50. The selling was relentless: silver sliced through the 100‑day SMA ($72.60) without a pause, accelerated through the psychological $70.00 level, and finally kissed the 200‑day simple moving average at $67.79 before a tiny bounce into the weekend close.
The 200‑day SMA is widely considered the dividing line between bull and bear markets for long‑term trend followers. Silver has not closed a full session below this level since October, and the fact that it settled essentially on top of it after a nearly 11% weekly drop sets up a high‑stakes test for next week. A confirmed daily close below $67.80 would open the door to a waterfall decline toward the $61.00‑$60.00 zone, where the next significant support — the March swing low — resides.
Daily RSI fell to 34, just four points above the oversold threshold of 30, signaling that momentum is stretched but still has room to run. The 14‑day ADX, a measure of trend strength, surged above 40, confirming that the downtrend is powerful and likely to continue in the near term.
The NFP Tipping Point
The technical breakdown was triggered by a macro shock. Nonfarm payrolls grew by 172,000 in May, nearly double the consensus estimate of 85,000 and also above the highest forecast in the Bloomberg survey. March and April figures were revised higher, adding 92,000 additional jobs, reinforcing the picture of an extraordinarily resilient US labour market. The unemployment rate held steady at 4.3%, below the level that would normally prompt the Fed to consider dovish action.
Market pricing pivoted violently. According to CME’s FedWatch tool, the probability of a rate hike by the December meeting surged past 67%, up from just over 40% before the report and from a mere 9.1% a month ago. More aggressive traders priced a roughly 60% chance of a move as early as October. The US Dollar Index (DXY) responded with its strongest session in two years, breaking decisively above the 100 level for the first time since the war began, closing at 100.01.
For silver, this was a worst‑case scenario: a hawkish Fed repricing coupled with a surging dollar. As a non‑yielding asset, silver becomes less attractive when real yields rise, and dollar strength directly increases its price for foreign buyers. The 10‑year Treasury yield jumped 12 basis points to 4.48%, raising the opportunity cost of holding bullion.
Geopolitics: A Fading Support Pillar
Throughout the first half of the year, silver drew significant support from escalating US‑Iran tensions. The war, now in its fourth month, has disrupted energy flows through the Strait of Hormuz and injected pervasive uncertainty into global trade. However, as the conflict has stretched into a grinding stalemate, the marginal impact of geopolitical headlines on silver has diminished. Markets have largely priced in the status quo, and the dollar has emerged as the preferred safe haven for capital flight.
Recent developments reflect this shift. Iran has paused indirect talks with the US, and Hezbollah rejected a US‑backed ceasefire proposal, but the stalemate is no longer a surprise. Unless there is a dramatic escalation (such as an attack on critical energy infrastructure or a direct confrontation involving a third party), the geopolitical risk premium embedded in silver appears to have peaked. A sudden de‑escalation, however, would likely remove the last remaining support pillar, pushing silver even lower.
Industrial Demand and the Physical Deficit: The Long‑Term Floor
Despite the brutal weekly breakdown, not all long‑term bullish factors have disappeared. The Silver Institute expects 2026 to mark a sixth consecutive annual supply deficit, with a projected shortfall of 46.3 million ounces — a 15% increase year‑over‑year. Global inventories have drawn down nearly 762 million ounces since 2021, a structural erosion that is not easily reversed. Silver’s production chain is highly complex: most silver is a byproduct of zinc and copper mining, and refining depends on sulfuric acid, which is itself derived from oil refining. Geopolitical disruptions to energy flows directly constrain sulphuric acid availability, limiting silver production even as prices rise.
On the demand side, industrial consumption from solar panel manufacturing (which consumes approximately 20% of annual silver supply), electric vehicles, 5G networks, and AI data centres continues to grow at a record pace. Chinese industrial demand, particularly from the photovoltaic sector, is accelerating significantly. These structural forces create a powerful long‑term floor that could limit the downside once the current macro‑driven liquidation runs its course.
However, in the short term, industrial concerns are also weighing on silver. Manufacturing sentiment in China and Europe has softened, and the strong dollar makes US‑priced commodities more expensive for foreign buyers. The tug‑of‑war between short‑term macro headwinds and long‑term supply deficits is likely to keep volatility elevated.
Key Technical Levels
- Immediate support: $67.80 (200‑day SMA), then $61.01 (March swing low).
- Critical breakdown level: A daily close below $67.80 would target $61.00 and then $60.00 psychological level.
- Immediate resistance: $70.00 (psychological round number), then $71.79 (May 28 low turned resistance).
- Bullish reversal signal: A daily close above $73.00 with expanding volume would question the current bearish momentum.
What to Watch Next Week
With the weekly close now settled, attention shifts to the upcoming economic calendar. The May Consumer Price Index (CPI) report, due on June 12, is the next major catalyst. Headline CPI is expected to rise 0.2% month‑over‑month, which would keep the annual rate near 3.5%. An upside surprise would cement expectations for a Fed hike and likely push silver through the 200‑day SMA toward the $61 zone. A softer print could spark a relief rally back toward $73.00.
The Federal Reserve’s two‑day policy meeting concludes on June 17. While no change is expected at this gathering, the updated dot plot and Chair Powell’s press conference will provide critical guidance on the path of rates for the remainder of 2026. If the median dot shifts to show one or two hikes by December, silver could face additional selling pressure.
For traders, the 200‑day SMA at $67.80 is the line in the sand. A confirmed break below this level opens the door to $61.00 and then $60.00. Until silver can recapture $70.00 on a sustained basis, the path of least resistance remains to the downside.
Sources: US Bureau of Labor Statistics, CME FedWatch, Bloomberg, Silver Institute, TradingView
Disclaimer: This content is for market information purposes only and does not constitute investment advice. Precious metals trading involves significant risk.

