

BTC Dips Below $60,000 Then Recovers to $61,000 – Technical Breakdown
Bitcoin experienced a sharp sell‑off that pushed its price below the psychological $60,000 level during the early trading hours of June 6, 2026. Within the next few hours, however, buyers stepped in and lifted the largest cryptocurrency back into the $61,000 band. The rebound, though not yet a full recovery, has provided some relief to leveraged long positions that were on the brink of liquidation.
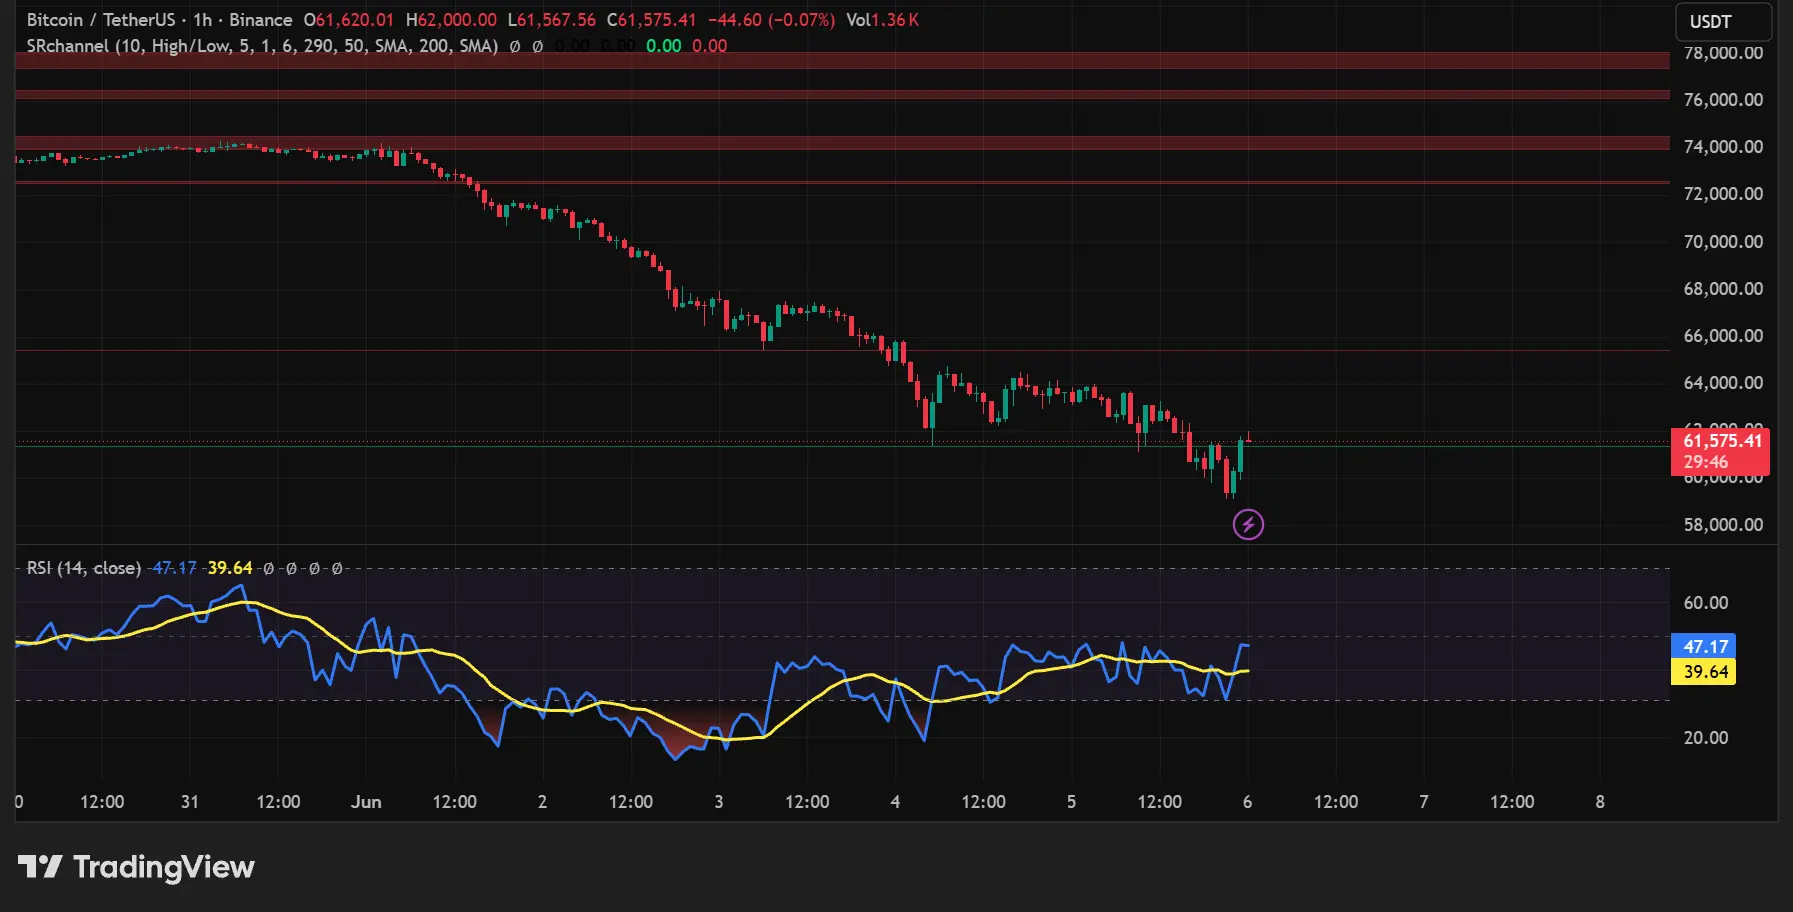
Chart Analysis – 4‑Hour Timeframe
On the 4‑hour chart (see above), the wick below $60,000 is clearly visible. Bitcoin touched a local low near $59,850 before reversing. This level aligns with the 61.8% Fibonacci retracement of the rally from $56,500 to $65,000, making it a technically significant support zone. The swift rejection of lower prices suggests that dip buyers and scalpers were active around the $60,000 round number.
The 4‑hour Relative Strength Index (RSI) dropped to 32, narrowly avoiding oversold territory (below 30), and has since bounced to 38. This indicates that selling momentum has cooled, but bullish conviction is not yet strong. Moving averages are still in a bearish alignment, with the 20‑EMA acting as dynamic resistance near $61,800.
Trading volume during the dip was notably higher than the 20‑period average, confirming that the breakdown was accompanied by real selling pressure rather than thin‑market manipulation. However, the subsequent recovery volume has been moderate, which raises the question of whether the rebound is driven by short‑covering rather than fresh accumulation.
Daily Chart Perspective
On the daily chart, Bitcoin has now broken below its 50‑day moving average ($62,400) for the first time since March. The 200‑day moving average sits at $57,800, offering a potential downside target if the $60,000 support fails again. The daily RSI has fallen to 42, down from 55 a week ago, indicating that the intermediate trend has weakened significantly.
What is notable on the daily timeframe is the formation of a lower high and a lower low – a classic technical pattern that signals a potential trend reversal from bullish to neutral or bearish. The previous swing high was near $71,500 in late May, and the current swing low is already below the previous low of $63,000, confirming a downtrend structure.
For the daily chart to turn positive again, Bitcoin would need to reclaim the $64,000 level and close above it on strong volume. Until then, the path of least resistance remains to the downside.
Liquidation Clusters and DeFi Risk
The drop below $60,000 triggered liquidations of approximately $120 million in leveraged long positions across major exchanges, according to Coinglass data. The largest cluster of liquidation levels was concentrated between $59,500 and $60,500, which explains the quick rebound once those positions were flushed out. With many weak hands cleared, the market may find it easier to stabilize in the short term.
On the DeFi front, the earlier report of 343,000 ETH at risk of liquidation remains a concern for Ethereum, but Bitcoin’s recovery has helped calm some of the panic. However, if BTC fails to hold $61,000 and rolls over again, a cascade of stop‑losses could be triggered below $59,500.
Key Levels to Watch
- Immediate resistance: $61,800 (4‑hour 20‑EMA), then $62,500 (50‑hour MA).
- Immediate support: $60,000 (psychological round number), then $59,500 (recent low).
- Critical breakdown level: $59,500 – a close below this on the 4‑hour chart would likely target $58,200 and then the 200‑day MA at $57,800.
- Bullish reversal signal: A 4‑hour candle close above $62,500 with increasing volume.
Market Sentiment and Next Moves
The crypto market remains highly sensitive to macro developments. Friday’s US jobs report and next week’s CPI data will heavily influence the Fed’s rate path, and any hawkish surprise could send Bitcoin back below $60,000. Conversely, a softer inflation print could fuel a broader risk‑asset rally, with BTC likely leading the charge.
For short‑term traders, the $60,000‑$61,800 range offers a battleground. A breakout above $61,800 would target $63,000, while a breakdown below $60,000 would open the door to $58,500. Until a decisive move occurs, choppy trading is expected.
Sources: TradingView chart analysis, Coinglass liquidation data, CoinNewsweek chart
Disclaimer: This content is for market information purposes only and does not constitute investment advice. Cryptocurrency trading involves high risk.

