

The precious metal suffered its steepest weekly decline since early May, shedding approximately 3.3% over the five‑day period. The selling climax came on Friday after the May US nonfarm payrolls report delivered a decisive upside surprise, crushing dovish expectations and re‑igniting debate over whether the Federal Reserve will be forced to raise interest rates later this year. Spot gold tumbled more than 3% in a single session, briefly breaking below $4,330 before settling near $4,327.95 – its lowest level since March and more than 18% below the pre‑war peak recorded before the US‑Israeli strikes on Iran in late February.
Weekly Chart: Bearish Engulfing Confirms Breakdown
The weekly candlestick pattern for the June 1‑5 session is unequivocally bearish. After gapping slightly higher on Monday, gold spent the first half of the week drifting sideways in a tight range between $4,460 and $4,500, hemmed in by a descending trendline that had capped rallies since the April highs. However, the real damage came on Friday when the jobs report triggered a sharp downward spike that overwhelmed nearby bid support.
The resulting weekly candle is a classic bearish engulfing formation: the candle completely engulfs the previous week’s body and closes near the low of the range. Key technical levels that had provided support for months were shattered. The psychological $4,500 level – which acted as a pivot zone throughout May – was taken out without hesitation, and the 200‑day simple moving average (SMA), located near $4,432, also failed to hold. A weekly close decisively below the 200‑day SMA is widely viewed by technical analysts as a medium‑term trend change signal.
Momentum on the weekly timeframe has also soured. The Relative Strength Index (RSI) fell from the low 50s to just above 40, while the MACD lines have crossed into negative territory. Volume expanded notably on the selloff, confirming that institutional money was exiting rather than simply retail panic.
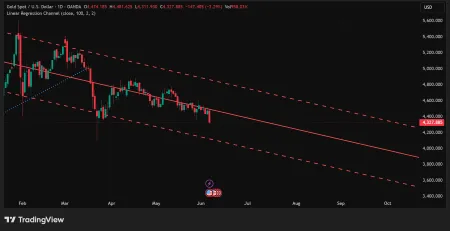
Daily and 4‑Hour Perspectives: A Broken Support Cascade
On the daily chart, gold closed the week below its 200‑day SMA for the first time since October, breaking a critical long‑term support that had contained pullbacks throughout the post‑war consolidation. After the breakdown, price action accelerated toward the next logical support zone around $4,300 – a level that coincides with the 61.8% Fibonacci retracement of the rally from the late‑2025 lows. Daily RSI plunged to 38, signaling that bearish momentum has room to run before reaching oversold territory.
The 4‑hour chart offers an even clearer picture of the cascading structure. Gold had been compressing within a descending channel since mid‑May, with resistance anchored near $4,510 and support near $4,450. Friday’s employment data provided the catalyst to break the lower boundary. What followed was a textbook “stop cascade”: sell stops below $4,450 were triggered, which pushed price down to the next cluster near $4,380, which in turn set off another wave of stops. This mechanical selling explains the magnitude of the 3.4% decline in a single session.
Should selling continue, the next downside targets are $4,300 (psychological round number and Fibonacci level), followed by $4,200‑$4,230 (rising trendline from the October 2025 lows). A break of that would expose the March cycle low near $4,098. On the upside, any relief rally would first need to reclaim the 200‑day SMA at $4,432 and then the broken channel support turned resistance near $4,450. Only a move above $4,500 would begin to question the new bearish trend.
Nonfarm Payrolls: The Tipping Point
The immediate catalyst for the breakdown was the May employment report. Nonfarm payrolls grew by 172,000 – nearly double the consensus estimate of 85,000 and also above the highest forecast in the Bloomberg survey. March and April figures were revised higher, adding to the picture of sustained labor market resilience. The unemployment rate held steady at 4.3%, below the threshold that would ordinarily prompt the Fed to consider dovish action.
Importantly, the blowout jobs number came just days after ADP reported private payroll growth of 122,000 in May, also above expectations. The back‑to‑back strength suggests that the US labor market has been largely insulated from the inflationary shock of higher energy prices – a dynamic highlighted in a recent Boston Fed study, which argued that structural changes in the US energy mix mean the economy can absorb higher oil prices with far less damage to employment than during the 1970s oil crises.
If strong hiring persists, the Fed’s focus will remain squarely on inflation, which has been elevated by the 33% surge in crude oil since the outbreak of war in late February. With the economy seemingly able to tolerate higher rates without falling into a recession, the central bank has a clear mandate to tighten further if price pressures do not abate.
Fed Rate Hike Probability Soars
Market pricing shifted violently after the payrolls release. According to CME’s FedWatch tool, the probability of a rate hike by the December meeting surged past 67%, up from just over 40% before the report and from a mere 9.1% a month ago. More aggressive traders are now pricing a roughly 60% chance of a move as early as October. Futures markets have fully priced in at least one quarter‑point hike by year‑end, with a second hike seen as a plausible but less‑than‑even chance.
This repricing has profound implications for gold. As a non‑yielding asset, gold becomes less attractive when real yields – yields adjusted for inflation – rise. The 10‑year Treasury yield jumped nearly 6 basis points to 4.53% on Friday, a fresh multi‑year high, directly increasing the opportunity cost of holding bullion. The dollar index (DXY) also broke above the psychologically important 100 level, closing at 100.01 and adding additional headwinds for dollar‑denominated commodities.
The hawkish turn in Fed expectations was reinforced by Cleveland Fed President Beth Hammack, one of the more vocal inflation hawks on the Federal Open Market Committee. In a statement following the jobs data, Hammack said that while steady rates are appropriate “for today,” if recent trends continue, “it may soon be appropriate to act” to address high inflation. Her remarks were taken as an explicit warning that a rate hike could come as soon as the July or September meeting, well ahead of the December timeline currently priced by markets.
Geopolitics: The Underlying Support That Failed to Hold
Throughout most of the first half of the year, gold drew support from escalating US‑Iran tensions. The war, now in its fourth month, has disrupted energy flows through the Strait of Hormuz, sent oil prices soaring, and injected pervasive uncertainty into global trade. In a typical safe‑haven regime, gold would be expected to rally on such headlines. However, the dynamic has been complicated.
First, the dollar itself has been a competing safe haven. As the conflict drags on, demand for the greenback – still the world’s reserve currency – has risen, particularly as the Fed signals a willingness to keep rates high. A strong dollar makes gold more expensive for foreign buyers. Second, and perhaps more importantly, the duration of the war is now priced in. Unless there is a dramatic escalation (or a sudden de‑escalation), the geopolitical risk premium embedded in gold has likely peaked.
Recent headlines reflect a stalemate. Hezbollah, an Iran‑backed militant group, rejected a US‑backed ceasefire proposal, and the Lebanese group stated that a regional truce is impossible while fighting continues in southern Lebanon. Iranian officials have repeatedly linked any broader agreement to a full Israeli withdrawal from occupied territories. With no breakthrough expected in the near term, the war has become a “grinding” reality rather than a shock event – and the marginal impact on gold has diminished. However, this does not mean geopolitical risk has vanished; a sudden widening of the conflict would quickly reverse the current bearish sentiment.
Central Bank Buying: A Long‑Term Floor but a Weak Short‑Term Support
Despite the sharp weekly decline, not all long‑term supports have disappeared. The World Gold Association reported that central banks resumed net gold purchases in April after a rare month of net selling in March, adding 17 tons to official reserves. For all of 2025, global central banks accumulated record tonnage, diversifying away from US Treasuries amid concerns over dollar weaponization and fiscal sustainability.
At the end of 2025, gold’s share of global official reserves rose to 27%, overtaking US Treasuries (22%) as the largest single reserve asset – a historic milestone. This trend reflects a structural shift that is unlikely to reverse even if the Fed raises rates. For gold, this means that while short‑term price action is dominated by macro and technical factors, the long‑term demand curve has shifted higher. A drop to $4,200 or even $4,000 would likely attract aggressive buying from central banks and institutional allocators who have been under‑allocated to the metal for years.
What to Watch Next Week
With the weekly close now settled, attention shifts to the upcoming economic calendar. The May Consumer Price Index (CPI) report, due on June 12, is the next major catalyst. Headline CPI is expected to rise 0.2% month‑over‑month, which would keep the annual rate near 3.5%. An upside surprise would cement expectations for a Fed hike and likely push gold down to test the $4,300 region. A softer print could spark a relief rally back toward the broken support at $4,432‑$4,450.
The Federal Reserve’s two‑day policy meeting concludes on June 17. While no change is expected at this gathering, the updated dot plot and Chair Powell’s press conference will provide critical guidance on the path of rates for the remainder of 2026. If the median dot shifts to show one or two hikes by December, gold could face additional selling pressure.
For short‑term traders, the $4,300 level is the line in the sand. A daily close below $4,300 would expose $4,200‑$4,230 and ultimately the $4,098 cycle low. Resistance above is layered: first $4,432 (broken 200‑day SMA), then $4,450 (prior channel support), and finally $4,500. Until gold can recapture $4,500 on a sustainable basis, the path of least resistance remains to the downside.
Sources: US Bureau of Labor Statistics, CME FedWatch, Bloomberg, World Gold Council, TradingView
Disclaimer: This content is for market information purposes only and does not constitute investment advice. Precious metals trading involves significant risk.

No Comment! Be the first one.