Spot Gold Crashes Below $4,600, Suffers Sharpest Drop Since 2025

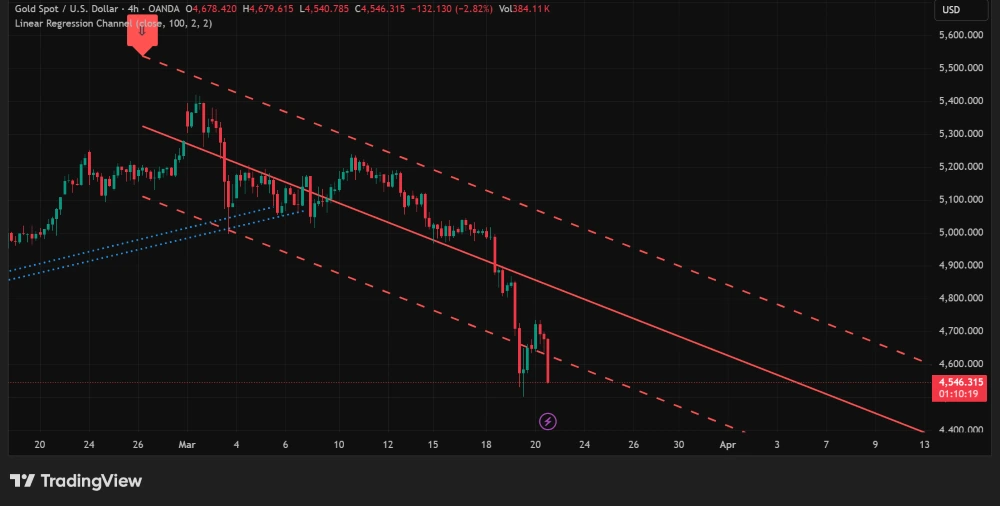
Spot gold (XAU/USD) has suffered a dramatic sell-off, plunging below the psychological $4,600 level and marking its steepest single-day decline since 2025. The precious metal collapsed to a session low of $4,540.79 before settling at $4,546.32, recording a staggering loss of $132.13 or -2.82% in a single session .
Technical Analysis: A Decisive Breakdown
The attached 4-hour chart from OANDA via TradingView reveals a technically significant breakdown. Gold had been trading within a well-defined linear regression channel (close, 100, 2, 2) since early March, with the upper boundary near $4,680 and the lower boundary providing dynamic support around $4,540-$4,560. Today’s sell-off saw prices slice through the lower band of this channel with conviction .
Key Technical Observations from the Chart:
– Current Price: $4,546.32
– Session High: $4,679.62
– Session Low: $4,540.79
– Session Loss: -$132.13 (-2.82%)
– Volume: 384.11K (significantly above average)
– RSI (Implied): Likely entered oversold territory below 30
The $4,546 level now represents critical near-term support. A break below this could open the door to the $4,400 region, which was last seen in early March. The volume surge to 384.11K confirms the selling pressure is genuine and broad-based, not merely thin-market volatility .
What’s Driving the Gold Sell-Off?
Several macro factors are converging to pressure gold prices:
1. Hawkish Fed Expectations: Interest rate futures are now pricing a 50% probability of a rate hike by October and a 65% probability by December. Higher interest rates increase the opportunity cost of holding non-yielding assets like gold, prompting investors to rotate out of the precious metal .
2. Surging Treasury Yields: The 10-year Treasury yield has climbed to 4.33%, its highest level since August 2025. Rising real yields make gold less attractive relative to interest-bearing assets .
3. U.S. Dollar Strength: The dollar index (DXY) has rallied sharply as traders price in a more hawkish Fed. A stronger dollar typically weighs on dollar-denominated commodities like gold .
4. Reduced Safe-Haven Demand: While geopolitical risks remain elevated, markets appear to be prioritizing the implications of tighter monetary policy over traditional safe-haven flows. Investors are increasingly positioning for a “higher for longer” interest rate environment .
5. Technical Breakout Selling: The breakdown below the linear regression channel likely triggered stop-loss orders and algorithmic selling, accelerating the downside move. The volume spike to 384.11K confirms this dynamic .
Levels to Watch
Immediate Support: $4,540 (session low) and $4,500 (psychological level)
Key Support Zone: $4,400-$4,450 (previous consolidation area from early March)
Immediate Resistance: $4,600 (former support turned resistance) and $4,620
Key Resistance: $4,650-$4,680 (lower and upper bounds of the broken channel)
A sustained break below $4,500 could accelerate selling toward $4,400. Conversely, a reclaim of $4,600 would suggest the breakdown was a false move and could trigger a short-covering rally back toward $4,650 .
Market Implications
The sharp decline in gold has implications across asset classes. Gold’s breakdown often signals shifting risk sentiment, with investors favoring yield-bearing assets over safe havens. The move also pressures other precious metals; silver (XAG/USD) is likely to follow gold lower if the sell-off continues .
For cryptocurrency markets, the correlation between gold and Bitcoin has weakened in recent years, but both remain sensitive to macro liquidity conditions. Rising yields and a stronger dollar create headwinds for risk assets broadly, including digital assets .
Analyst Perspectives
“The breakdown below $4,600 is technically significant,” said a senior commodities analyst. “Gold had been holding above this level since early March, and the volume confirmation suggests this is not a false breakdown. The market is now pricing in a Fed that is done cutting and may even need to hike again, which is bearish for gold.”
However, some analysts caution that the sell-off may be overextended. “With RSI likely below 30, gold is technically oversold,” noted a technical strategist. “A bounce toward $4,600 is possible in the near term, but the broader trend will depend on whether the Fed actually delivers on these hawkish expectations.”
As the market digests the implications of shifting rate expectations, gold traders will be closely watching upcoming economic data, particularly inflation reports and labor market figures, for confirmation of the Fed’s policy path .
Sources: TradingView, OANDA, CME FedWatch, Bloomberg, Reuters.
Disclaimer: This content is for market information purposes only and is not investment advice. Precious metals trading involves significant risk and may not be suitable for all investors.

