Spot Gold Falls Below $5,000 Mark as Iran Conflict and Inflation Fears Weigh on Precious Metals

Spot gold has fallen below the critical $5,000 per ounce level, dropping to approximately $4,983 as of March 17, 2026. The decline marks a significant retreat from the all-time high of $5,602 reached on January 28, representing a correction of over 11% from the peak.
What’s Driving Gold Lower?
The selloff in gold is being driven by a complex mix of macroeconomic and geopolitical factors:
- Surging oil prices and inflation fears: Oil has surged above $100 per barrel — up more than 40% this month to its highest levels since 2022 — after U.S.-Israeli strikes on Iran prompted Tehran to halt shipments through the Strait of Hormuz. Higher oil prices are stoking inflation concerns, which could force the Federal Reserve to adopt a more hawkish stance, dulling the appeal of non-yielding gold.
- Fed policy uncertainty: The Fed meets this week for a two-day policy meeting and is widely expected to hold rates steady. However, the market is now pricing in the possibility that the Fed could pivot away from rate cuts entirely if inflation accelerates further. As Natixis analyst Bernard Dahdah noted, “Higher oil prices mean higher inflation and this has repercussions on the Fed.”
- Kevin Warsh nomination effect: The nomination of Kevin Warsh as the next Federal Reserve Chair initially sent the dollar higher, triggering a wave of profit-taking across precious metals. Gold experienced its worst single-day plunge since 1983 in late January, dropping 9.8%.
- Broader precious metals correction: The selloff is not limited to gold. Spot silver has plunged below $80, platinum is holding near $2,025, and palladium has slid to $1,543. The entire precious metals complex is under pressure.
The Iran-U.S. Conflict Factor
The ongoing U.S.-Israeli military operations against Iran, now in their third week, have created a paradoxical situation for gold. While geopolitical conflict typically supports safe-haven demand, the resulting oil price shock is fueling inflation fears that outweigh the safe-haven bid. U.S. President Donald Trump has pressed allies to help secure the Strait of Hormuz as Iranian forces continue attacks on the vital waterway.
UBS noted in a research report: “The longer the U.S.-Iran conflict goes on, the higher the risk of negative economic impacts, which should support hedging demand for gold.” However, in the short term, the inflation-driven repricing of Fed expectations is dominating.
Technical Outlook: XAUUSD Chart Analysis
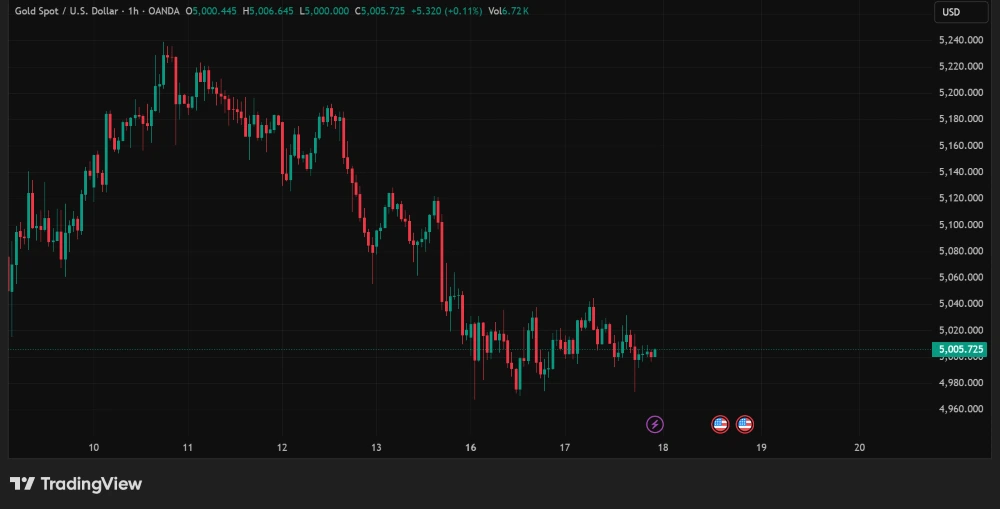
The XAUUSD daily chart reveals a clear breakdown below the psychological $5,000 level, which had served as a key support during the multi-month rally. The price action shows sustained bearish momentum with consecutive red candles, indicating persistent selling pressure following the January all-time high of $5,602.
Key technical levels to watch:
- Immediate support: $4,900 – $4,850 range, aligning with previous consolidation zones from early February.
- Major support: $4,600 – $4,500, which coincides with UBS’s downside scenario target and could attract significant institutional buying.
- Resistance: A reclaim of $5,000 would be the first bullish signal, with $5,200 and $5,400 as the next upside targets.
Volume has increased notably during the decline, suggesting conviction-driven selling rather than thin liquidity. The RSI is approaching oversold territory, which could set the stage for a short-term relief bounce.
Wall Street Still Bullish Long-Term
Despite the current correction, major investment banks remain structurally bullish on gold for 2026:
- J.P. Morgan: Year-end target of $6,300/oz, forecasting central bank purchases of 800 tons in 2026.
- UBS: Target of $6,200/oz, with an upside scenario of $7,200 if geopolitical tensions escalate further.
- Deutsche Bank: Maintains $6,000/oz forecast, citing sustained investor appetite.
- Goldman Sachs: $5,400/oz target, with a moderate outlook.
J.P. Morgan stated: “Even with the recent near-term volatility, we remain firmly bullishly convicted in gold over the medium-term on the back of a clean, structural, continued diversification trend.”
What’s Next for Gold?
The $5,000 level is a critical psychological and technical support zone. A sustained break below could push gold toward the $4,600 – $4,500 range, while a rebound could target $5,200 and beyond. This week’s Fed meeting will be pivotal — any signal of a hawkish pivot could deepen the selloff, while dovish language could trigger a sharp recovery.
Central bank meetings from the ECB, Bank of England, and Bank of Japan are also scheduled this week, with the focus on policymakers’ assessment of the Iran conflict’s impact on inflation, growth, and future monetary policy. The structural supply-demand dynamics — including central bank accumulation and de-dollarization trends — suggest the long-term bull case remains intact despite the current turbulence.
Sources: Kitco / CME Group / World Gold Council / LBMA / TradingView
Disclaimer: This content is for market information purposes only and is not investment advice.


