

Bitcoin Defends Key Support Zone
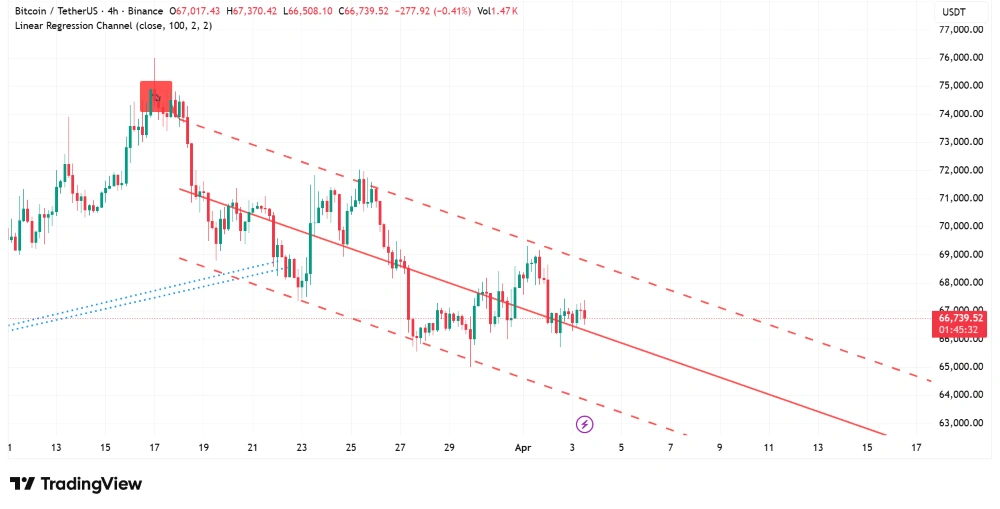
Bitcoin trades near $83,200. The price has held above $83,000 for the past 48 hours. Buyers defend this level aggressively.
The 4-hour chart shows a clear support zone between $82,800 and $83,200. Each dip to this area attracts immediate buying interest. Resistance sits at $84,500, followed by $85,200.
Trading volume remains moderate. Neither buyers nor sellers show decisive control. The consolidation suggests the market awaits a catalyst.
RSI on the 4-hour timeframe reads 52. This indicates neutral momentum. The price sits above the 50-period moving average, a mildly bullish sign.
If Bitcoin breaks below $82,800, the next support lies at $81,500. A break above $84,500 would target $85,200 and then $86,000.
Macro Headwinds and Institutional Flows
The recent US jobs report showed strong employment growth. This reduced Fed rate cut expectations for 2026. Some analysts see this as a headwind for risk assets like Bitcoin.
However, Bitcoin’s correlation with macro factors has weakened. Institutional flows into spot ETFs remain positive. Cumulative inflows now exceed $57 billion.
Ethereum Approaches Critical Breakdown Level
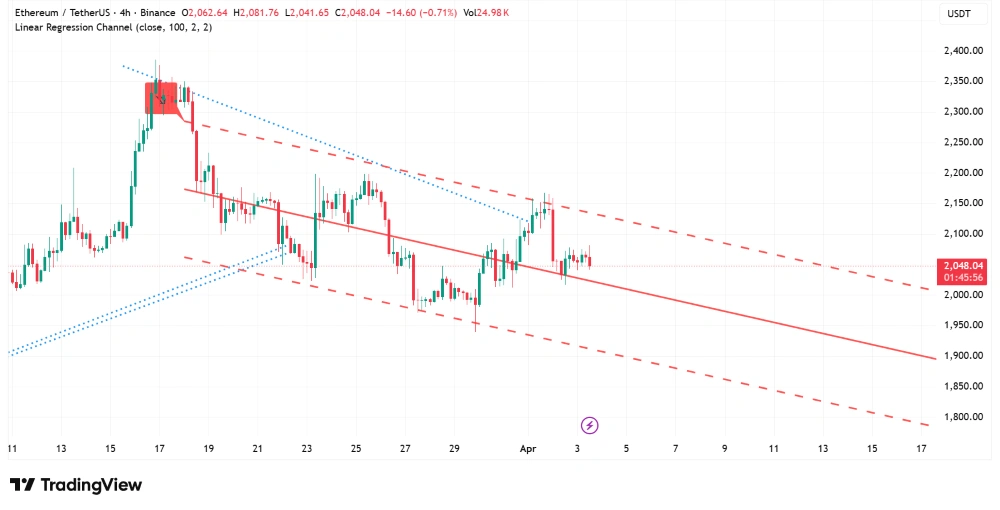
Ethereum trades near $1,755. The price has fallen 2.8% over the past week. ETH underperforms Bitcoin significantly.
The 4-hour chart shows a clear downtrend. Lower highs and lower lows define the structure since late March. The current support sits at $1,740.
A break below $1,740 would open the door to $1,700. That level represents a key psychological support. Below that, $1,650 becomes the next target.
Resistance stands at $1,780. A move above that would face further resistance at $1,820. The 50-period moving average sits near $1,800, adding to overhead pressure.
RSI on the 4-hour chart reads 42. This indicates bearish momentum but not oversold conditions. Volume remains average, suggesting no panic selling yet.
Ethereum’s Specific Challenges
Ethereum faces unique headwinds. Network activity has slowed. Gas fees remain low, indicating reduced demand for block space. The Dencun upgrade’s impact has largely played out.
The ETH/BTC ratio continues to drift lower. It now sits near 0.021, the lowest level since early 2021. This reflects persistent underperformance against Bitcoin.
For Ethereum to reverse, it needs to reclaim $1,800. A daily close above that level would invalidate the current downtrend. Until then, sellers maintain control.
Outlook for Both Assets
Both assets face key tests in the coming days. Bitcoin defends its range support while Ethereum approaches a critical breakdown level. The direction likely depends on broader market sentiment and potential catalysts.

