

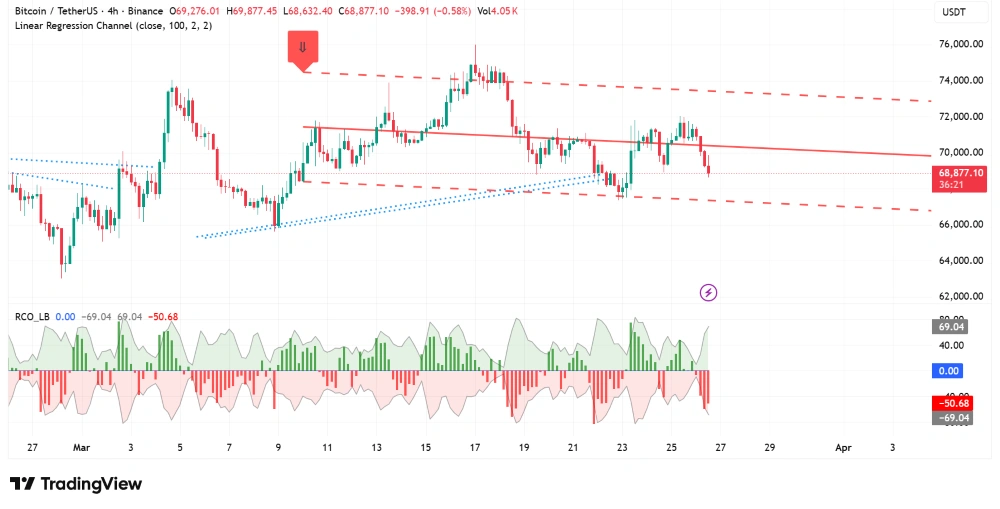
Bitcoin (BTC) has broken below the critical $69,000 level, extending its recent downtrend as bearish momentum accelerates. The 4-hour chart reveals a decisive breakdown from the linear regression channel that had contained price action since early March. Currently trading at $68,877.10, BTC has fallen 0.58% in the latest 4-hour candle, with a session low of $68,632.40 and a high of $69,877.45 .
Technical Analysis: Channel Breakdown Signals Further Weakness
The 4-hour chart tells a clear story of accelerating selling pressure. Bitcoin had been trading within a well-defined linear regression channel (close, 100, 2, 2) since early March, with the upper boundary providing resistance and the lower boundary offering dynamic support around the $69,000 level. Today’s price action saw the asset slice through this lower band with conviction, closing below the critical support zone .
Key Technical Observations:
– Current Price: $68,877.10
– Session High: $69,877.45
– Session Low: $68,632.40
– 4-Hour Change: -0.58% ($398.91)
– Volume: 4.05K (elevated compared to recent sessions)
The breakdown below the channel’s lower band is technically significant. The linear regression channel had contained price action for nearly three weeks, and the decisive breach suggests that sellers have gained control. The next major support level to watch is $68,000, followed by the $67,500 region—a level last seen in mid-March .
Why Is Bitcoin Dropping?
Several macro and technical factors are converging to pressure Bitcoin prices:
1. Hawkish Fed Expectations: Interest rate futures continue to price in a growing probability of a rate hike by October (50%) and December (65%). Higher rates increase the opportunity cost of holding risk assets like Bitcoin, prompting institutional investors to reduce exposure .
2. Dollar Strength: The DXY dollar index has rallied to its highest level since January, putting downward pressure on dollar-denominated assets. A stronger dollar typically correlates with weaker Bitcoin prices .
3. ETF Flow Dynamics: After four weeks of positive inflows, Bitcoin ETF flows have shown signs of cooling. Recent data suggests that the pace of institutional accumulation may be slowing, removing a key support pillar that had helped stabilize prices .
4. Technical Breakdown Selling: The breach of the $69,000 level likely triggered stop-loss orders and algorithmic selling, accelerating the downside move. The 4-hour chart shows that selling intensified as price approached and broke through the channel support .
5. Profit-Taking After Consolidation: Bitcoin had been consolidating in a narrow range above $70,000 for several days. The inability to break higher led to profit-taking, with traders who accumulated positions near $71,000 choosing to exit .
Support and Resistance Levels
Immediate Support: $68,600 (session low) and $68,000 (psychological level)
Major Support Zone: $67,500-$67,800 (mid-March lows)
Immediate Resistance: $69,000 (broken support, now resistance) and $69,500
Major Resistance: $70,000 (psychological level) and $71,000 (recent highs)
The $69,000 level, which had acted as support for much of the past week, has now flipped to resistance. For any bullish reversal to occur, Bitcoin would need to reclaim this level and hold above it. Failure to do so could see prices drift toward the $67,500-$68,000 region in the coming sessions .
Fundamental Catalysts Ahead
Bitcoin’s direction in the near term will likely be dictated by upcoming economic data and central bank commentary:
– US PCE Inflation Data (Friday): The Fed’s preferred inflation gauge will be the week’s biggest event. A hotter-than-expected print would strengthen the case for a rate hike, pressuring Bitcoin further. A softer reading could trigger a relief rally .
– Fed Speakers: Multiple Fed officials are scheduled to speak. Any hawkish commentary could reinforce the current dollar strength and weigh on risk assets .
– ETF Flow Data: Continued outflows or slowing inflows from Bitcoin ETFs would add to selling pressure. Conversely, a reversal back to inflows could support prices .
Market Sentiment and Outlook
The breakdown below $69,000 represents a significant technical development. The 4-hour chart shows that sellers have been in control, with each rally attempt being met with fresh selling pressure. The linear regression channel breakdown suggests that the bearish trend that began in mid-March may be accelerating .
However, traders should note that the RSI (implied) is approaching oversold territory on the 4-hour timeframe, which could precede a short-term bounce. Any relief rally, however, is likely to face resistance at the $69,000-$69,500 zone, where the broken channel’s lower band now acts as overhead supply .
For now, the path of least resistance appears lower. Unless there is a significant shift in the macro narrative—such as a dovish pivot from the Fed or a sharp reversal in ETF flows—Bitcoin may continue to face headwinds. The $67,500-$68,000 region represents the next key downside target if selling pressure persists .
Sources: TradingView, Binance, CME FedWatch, SoSoValue.

