

Gold Weekly Outlook: Can Bulls Defend $4,500 After Friday’s 1.87% Plunge?

Gold (XAU/USD) ended the previous week on a sour note, suffering a sharp 1.87% decline on Friday that dragged prices down to $4,497. The sell-off marked the metal’s worst weekly close since early March, wiping out gains from the previous two sessions and leaving traders questioning whether the bullish momentum that characterized early 2026 has finally run its course .
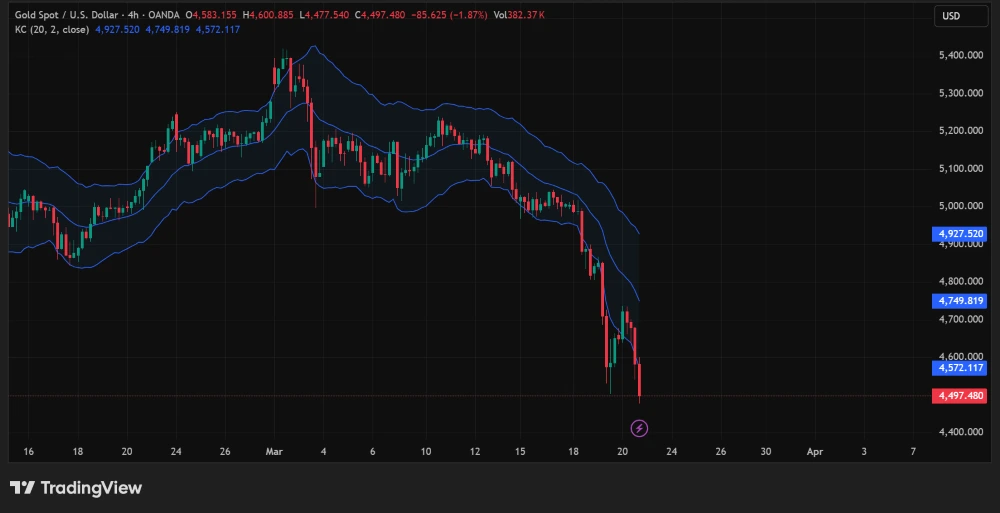
Friday’s Sell-Off in Review
The 4-hour chart tells a clear story of rejection. After failing to hold above $4,580, gold sliced through the Keltner Channel’s middle band (currently at $4,749) and the lower band ($4,972) before settling near session lows. The candle closed at $4,497, marking a decisive breakdown from the consolidation range that had held for much of March .
Volume surged to 382.37K, well above recent averages, confirming that the selling pressure was genuine and broad-based rather than a thin-market anomaly. The move also broke below the psychological $4,500 level, a threshold that had acted as support during the previous week’s trading .
What Drove Gold Lower?
Friday’s sell-off didn’t happen in isolation. Several converging factors weighed on the precious metal:
1. Hawkish Fed Repricing: Interest rate futures continued to price in a growing probability of a rate hike by October (now at 50%) and December (65%). Higher rates increase the opportunity cost of holding non-yielding gold, prompting institutional investors to reduce exposure .
2. Dollar Strength: The DXY dollar index rallied sharply last week, climbing to its highest level since January. A stronger dollar makes dollar-denominated gold more expensive for foreign buyers, dampening demand .
3. Rising Treasury Yields: The 10-year Treasury yield hit 4.33%, its highest since August 2025. Real yields (adjusted for inflation) have turned positive, making interest-bearing assets more attractive relative to gold .
4. Technical Breakdown: The breach of the Keltner Channel’s lower band triggered algorithmic selling and stop-loss orders, accelerating the downside move. The rejection at $4,580 also marked a lower high on the 4-hour timeframe, suggesting bearish momentum is building .
How Gold May Start the New Week
As Asian markets prepare to open, several scenarios are in play:
Scenario 1: Defensive Hold Above $4,500 (Bullish)
If gold can reclaim and hold above the $4,500 psychological level in early trading, it would suggest that Friday’s sell-off was an overreaction. A bounce toward $4,580 (Friday’s rejection level) would be the first test. Success there would target the Keltner Channel middle band near $4,749. This scenario is more likely if upcoming economic data (particularly PCE inflation) comes in softer than expected, easing Fed hawkishness .
Scenario 2: Consolidation Between $4,450 and $4,550 (Neutral)
The most probable outcome given current momentum. Gold may trade in a range as traders await fresh catalysts. The $4,500 level will act as a battleground, with support at $4,477 (Friday’s low) and resistance at $4,550. This scenario would reflect uncertainty ahead of key US inflation data later this week .
Scenario 3: Extended Decline Below $4,450 (Bearish)
A break below Friday’s low of $4,477 would open the door to the $4,400 region—a level not seen since early March. Such a move would likely be triggered by further dollar strength or another upward surprise in inflation expectations. The Keltner Channel’s lower band (currently near $4,972) is now far above price, indicating oversold conditions, but momentum could carry lower if sellers remain aggressive .
Key Levels to Watch for the Week Ahead
Immediate Support: $4,477 (Friday’s low) and $4,450 (psychological level)
Major Support Zone: $4,400-$4,420 (early March lows)
Immediate Resistance: $4,500 (psychological) and $4,550
Major Resistance: $4,580 (Friday’s rejection) and $4,749 (Keltner Channel middle band)
Fundamental Catalysts to Watch
Several data releases and events could dictate gold’s direction this week:
– US PCE Inflation Data (Friday): The Fed’s preferred inflation gauge will be the week’s biggest event. A hotter-than-expected print would strengthen the case for a rate hike, pressuring gold. A softer reading could trigger a relief rally .
– Fed Speakers: Multiple Fed officials are scheduled to speak. Any hawkish commentary could reinforce the current dollar strength and weigh on gold .
– Geopolitical Developments: Ongoing Middle East tensions could provide a floor for gold if safe-haven flows return, but this has been overshadowed by rate expectations recently .
Technical Outlook Summary
The 4-hour chart shows gold trading below all three Keltner Channel bands, a sign of strong bearish momentum. However, the RSI (implied) is likely in oversold territory below 30, suggesting that a short-term bounce is possible. The key question for the week ahead is whether buyers step in to defend the $4,500 level or if the breakdown marks the beginning of a deeper correction toward $4,400 .
Traders should watch for the first 4-hour candle of the week. A close above $4,500 would signal resilience; a close below $4,480 would invite further selling. With the Fed’s next move now the dominant narrative, gold’s direction will likely be decided by the interplay between inflation data, dollar strength, and technical levels .
Sources: TradingView, CME FedWatch.
Disclaimer: This content is for market information purposes only and is not investment advice. Precious metals trading involves significant risk.
