

Bitcoin Snaps 5-Month Losing Streak But April Opens With Fresh Volatility
Bitcoin closed March with a modest 1.8% gain, marking its first positive monthly close since September 2025 and ending a five-month streak of red candles. According to Coinglass data, the last time Bitcoin recorded a positive month was September 2025, when it gained 5.16%. The intervening months—October (-3.69%), November (-17.67%), December (-2.97%), January (-10.17%), and February (-14.96%)—had all been in the red .
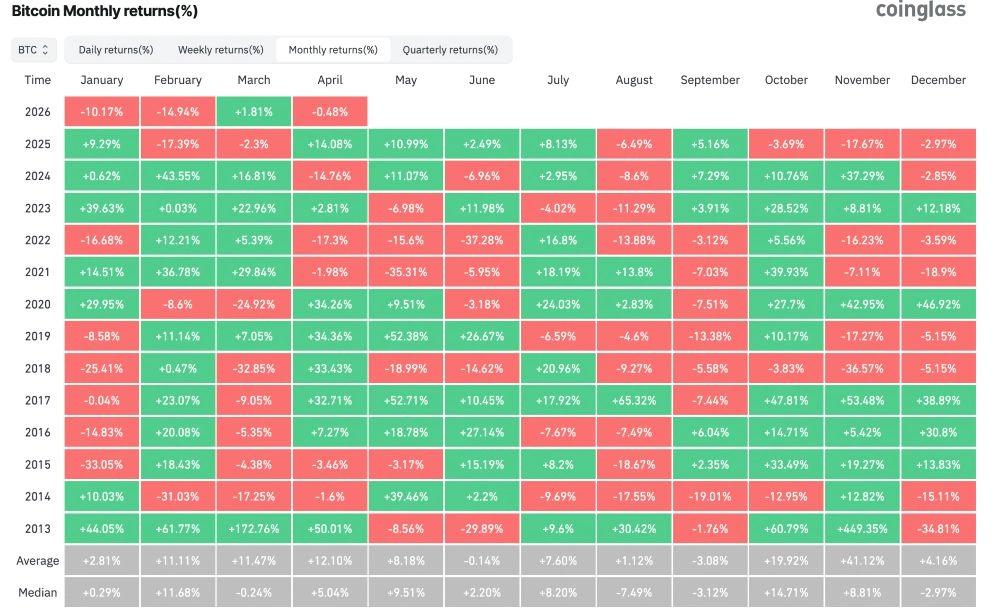
The 1.8% gain, while positive, was a far cry from the double-digit surges that characterized previous bull cycles. In March 2024, Bitcoin had gained 16.81%; in March 2023, it jumped 22.96%; and in March 2021, it soared 29.84%. The slim margin of this month’s recovery highlights the fragility of the current market environment .
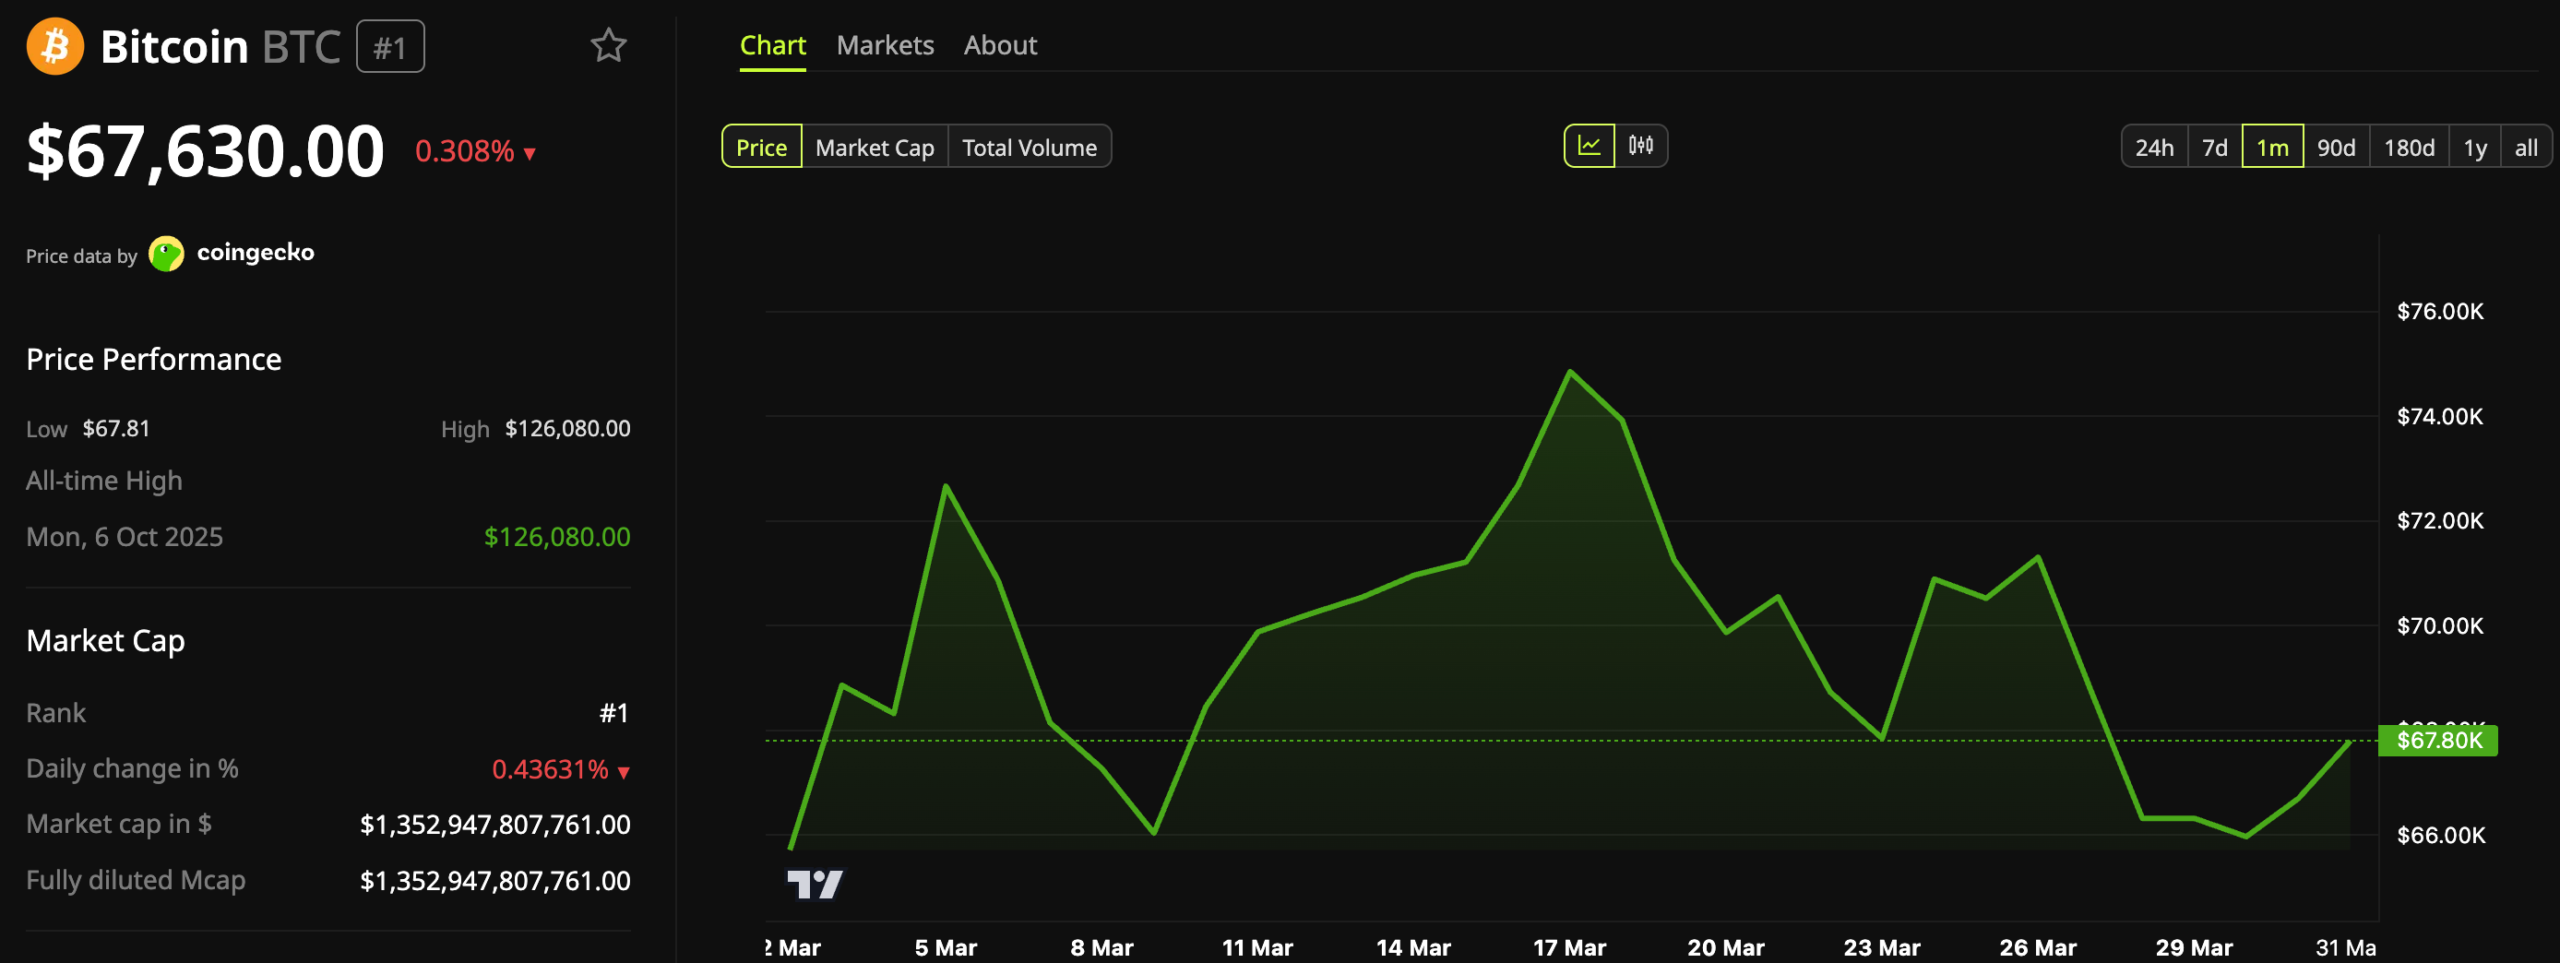
April has opened on a volatile note. According to the latest price data, Bitcoin is currently trading at $67,630, down 0.31% from recent levels. The cryptocurrency’s market capitalization stands at $1.352 trillion, maintaining its position as the world’s largest digital asset by a wide margin. The all-time high of $126,080 was reached on October 6, 2025—a level that now seems distant as the market navigates its prolonged downturn .
Historically, April has been one of Bitcoin’s strongest months, with an average return of 12.1% and a median of 5.04% according to Coinglass data. But seasonality has offered little guidance in recent months. January and February posted losses of 10.17% and 14.96%, respectively—both well below their long-term averages. The divergence from historical norms suggests that the market is operating under a different set of dynamics than in previous cycles .
On the geopolitical front, Binance Research noted that concrete US-Iran ceasefire signals could extend crypto’s recovery, with higher-beta assets like Ethereum potentially outperforming Bitcoin. However, the firm cautioned that “caution is still warranted,” pointing to the absence of formal negotiations, Israel’s more aggressive objectives, and ongoing threats from Iran’s Revolutionary Guard Corps against major US tech firms .
Technical analysts have offered contrasting views. CryptosRus highlighted that copper hitting cycle lows while gold’s rate of change peaked preceded Bitcoin surges in both 2016 and 2020. “Today’s macro conditions align closely with those setups, even as market sentiment lags behind. The market hasn’t priced this convergence in yet,” the analysis noted .
Others maintain a more cautious outlook. Joao Wedson, CEO of Alphractal, observed that Bitcoin’s cycle top occurred 534 days after the April 2024 halving—the shortest cycle top to date. “This decaying pattern across cycles suggests the historical bottom may occur between 912 and 922 days after the Halving. That points to a bottom in late September or early October 2026,” he stated .
CryptoQuant’s models align with that timeline. The firm estimates the market could bottom between June and December 2026, with September through November as the most likely window. Many analysts now suggest the bottom could lie around or below $40,000, indicating the possibility of further declines in the coming months .
For traders looking at shorter timeframes, the path remains uncertain. The combination of geopolitical tension, macroeconomic headwinds, and the lingering effects of a prolonged bear market has created an environment where historical patterns offer limited predictive power. Whether April follows its historical bullish script or diverges like the months before it remains one of the key questions for the market in the coming weeks .

