

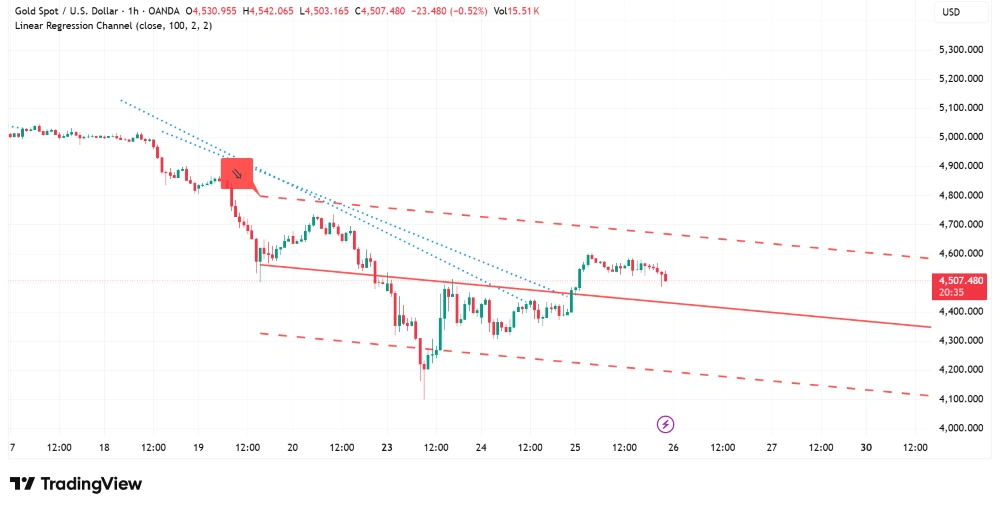
Spot gold (XAU/USD) has broken below the psychologically significant $4,500 level, extending its recent downtrend as bearish momentum accelerates. The precious metal touched a session low of $4,503.17 before settling at $4,507.48, marking a decline of 0.52% on the 1-hour timeframe. The breakdown comes amid persistent pressure from a stronger US dollar and hawkish Federal Reserve expectations .
Technical Analysis: Channel Breakdown Signals Further Weakness
The 1-hour chart tells a clear story of accelerating selling pressure. Gold had been trading within a well-defined linear regression channel (close, 100, 2, 2) since mid-March, with the upper boundary near $4,540 and the lower boundary providing dynamic support around $4,510-$4,520. Today’s price action saw the metal slice through the lower band of this channel with conviction, closing below the critical $4,500 psychological level .
Key Technical Observations:
– Current Price: $4,507.48
– Session High: $4,542.07
– Session Low: $4,503.17
– Session Change: -$23.48 (-0.52%)
– Volume: 15.51K (elevated compared to recent sessions)
The breakdown below the channel’s lower band is technically significant. The linear regression channel had contained price action for over a week, and the decisive breach suggests that sellers have gained control. The next major support level to watch is $4,450, followed by the $4,400 region—a level not seen since early March .
What’s Driving Gold Lower?
Several macro factors are converging to pressure gold prices:
1. Hawkish Fed Repricing: Interest rate futures continue to price in a growing probability of a rate hike by October (now at 50%) and December (65%). Higher rates increase the opportunity cost of holding non-yielding gold, prompting institutional investors to reduce exposure .
2. Dollar Strength: The DXY dollar index has rallied to its highest level since January, making dollar-denominated gold more expensive for foreign buyers. The strong dollar has been a persistent headwind for the precious metal throughout March .
3. Rising Treasury Yields: The 10-year Treasury yield remains elevated near 4.33%, its highest since August 2025. Real yields have turned positive, making interest-bearing assets more attractive relative to gold .
4. Technical Selling: The breach of the $4,500 level likely triggered stop-loss orders and algorithmic selling, accelerating the downside move. The 1-hour chart shows that selling intensified as price approached the critical level .
Support and Resistance Levels
Immediate Support: $4,500 (psychological, now resistance) and $4,477 (previous low)
Major Support Zone: $4,450 and $4,400 (early March lows)
Immediate Resistance: $4,520 (channel lower band) and $4,540 (channel mid-band)
Major Resistance: $4,580 (previous rejection level)
The $4,500 level, which had acted as support for much of March, has now flipped to resistance. For any bullish reversal to occur, gold would need to reclaim this level and hold above it. Failure to do so could see prices drift toward the $4,400 region in the coming sessions .
Fundamental Catalysts Ahead
Gold’s direction in the near term will likely be dictated by upcoming economic data and central bank commentary:
– US PCE Inflation Data (Friday): The Fed’s preferred inflation gauge will be the week’s biggest event. A hotter-than-expected print would strengthen the case for a rate hike, pressuring gold further. A softer reading could trigger a relief rally .
– Fed Speakers: Multiple Fed officials are scheduled to speak. Any hawkish commentary could reinforce the current dollar strength and weigh on gold .
– Geopolitical Developments: While geopolitical risks remain elevated, they have been overshadowed by the interest rate narrative. Any escalation could provide a temporary floor for gold, but the dominant driver remains monetary policy expectations .
Outlook: Bearish Momentum May Persist
The breakdown below $4,500 represents a significant technical development. The 1-hour chart shows that sellers have been in control, with each rally attempt being met with fresh selling pressure. The linear regression channel breakdown suggests that the bearish trend that began in mid-March may be accelerating .
However, traders should note that the RSI (implied) is likely approaching oversold territory on the 1-hour timeframe, which could precede a short-term bounce. Any relief rally, however, is likely to face resistance at the $4,520-$4,540 zone, where the broken channel’s lower and middle bands now act as overhead supply .
For now, the path of least resistance appears lower. Unless there is a significant shift in the macro narrative—such as a dovish pivot from the Fed or a sharp escalation in geopolitical tensions—gold may continue to face headwinds. The $4,400 level represents the next key downside target if selling pressure persists .
Sources: TradingView, CME FedWatch, Bloomberg.

