

BTC/Gold Correlation Hits 3-Year Low, Signaling a Bitcoin Bottom
The correlation between Bitcoin and gold has plunged to its lowest level in three years, flashing a rare signal that analysts say has historically preceded major Bitcoin bottoms. As March enters its final week, gold is on track for its fourth consecutive weekly decline, while Bitcoin continues to consolidate near the $70,000 level. This growing divergence is drawing increasing attention from market observers who see it as a potential inflection point .
BTC/Gold Ratio Points to a Bottom
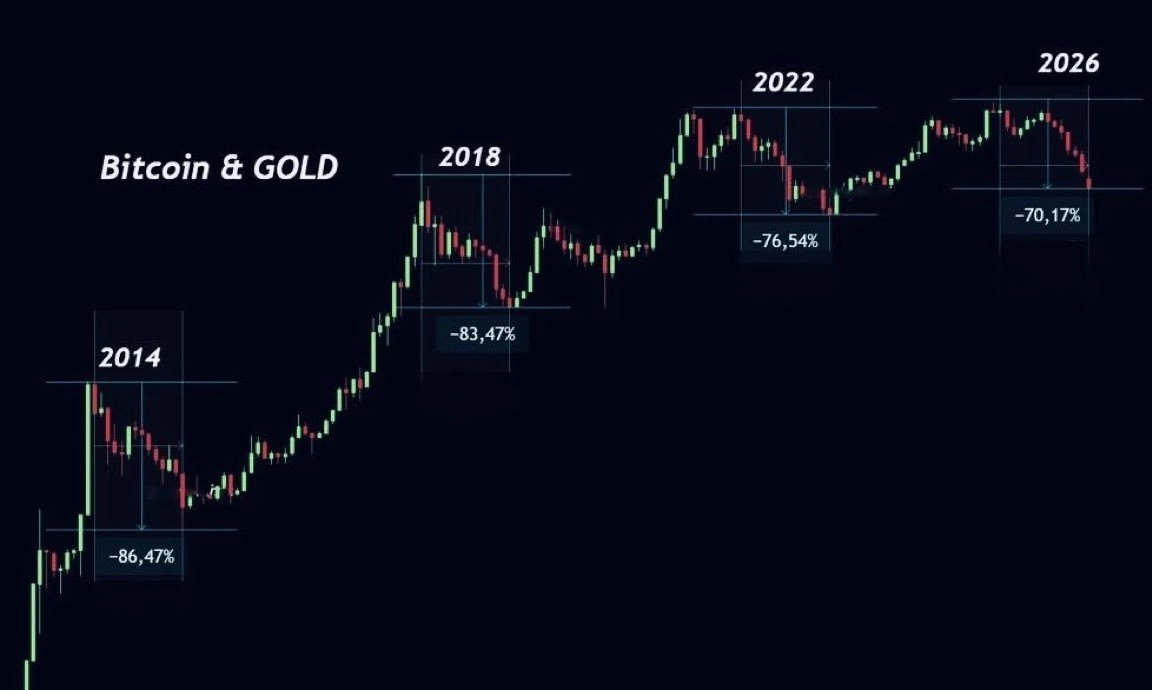
Analyst Michaël van de Poppe has been closely studying the BTC/Gold ratio chart, noting that the current 70% drawdown closely matches historical bottoms following bear cycles lasting 13 to 14 months. Previous deep drawdowns in this ratio—86% in 2014, 83% in 2018, and 76% in 2022—all marked cycle bottoms. When the ratio recovers, it indicates that Bitcoin is outperforming gold .
A fascinating chart.
— Michaël van de Poppe (@CryptoMichNL) March 23, 2026
What if we have already finished the bear market and are currently consolidating?#Bitcoin vs. Gold is my prime chart.
If you look at those valuations, you can clearly see that the current bear market has experienced a 70% drawdown.
In any bear market,… pic.twitter.com/qrpO6Vgq4G
📌 Twitter Embed Description: Michaël van de Poppe analyzes the BTC/Gold ratio chart, noting a 70% drawdown that matches historical bottom patterns from 2014, 2018, and 2022.
Van de Poppe believes the chart may no longer be declining. Instead, it appears to be entering a consolidation phase, opening the door for a potential recovery in Bitcoin. In the short term, a bullish divergence on the BTC/Gold chart further strengthens the expectation that Bitcoin will outperform gold in the near term .
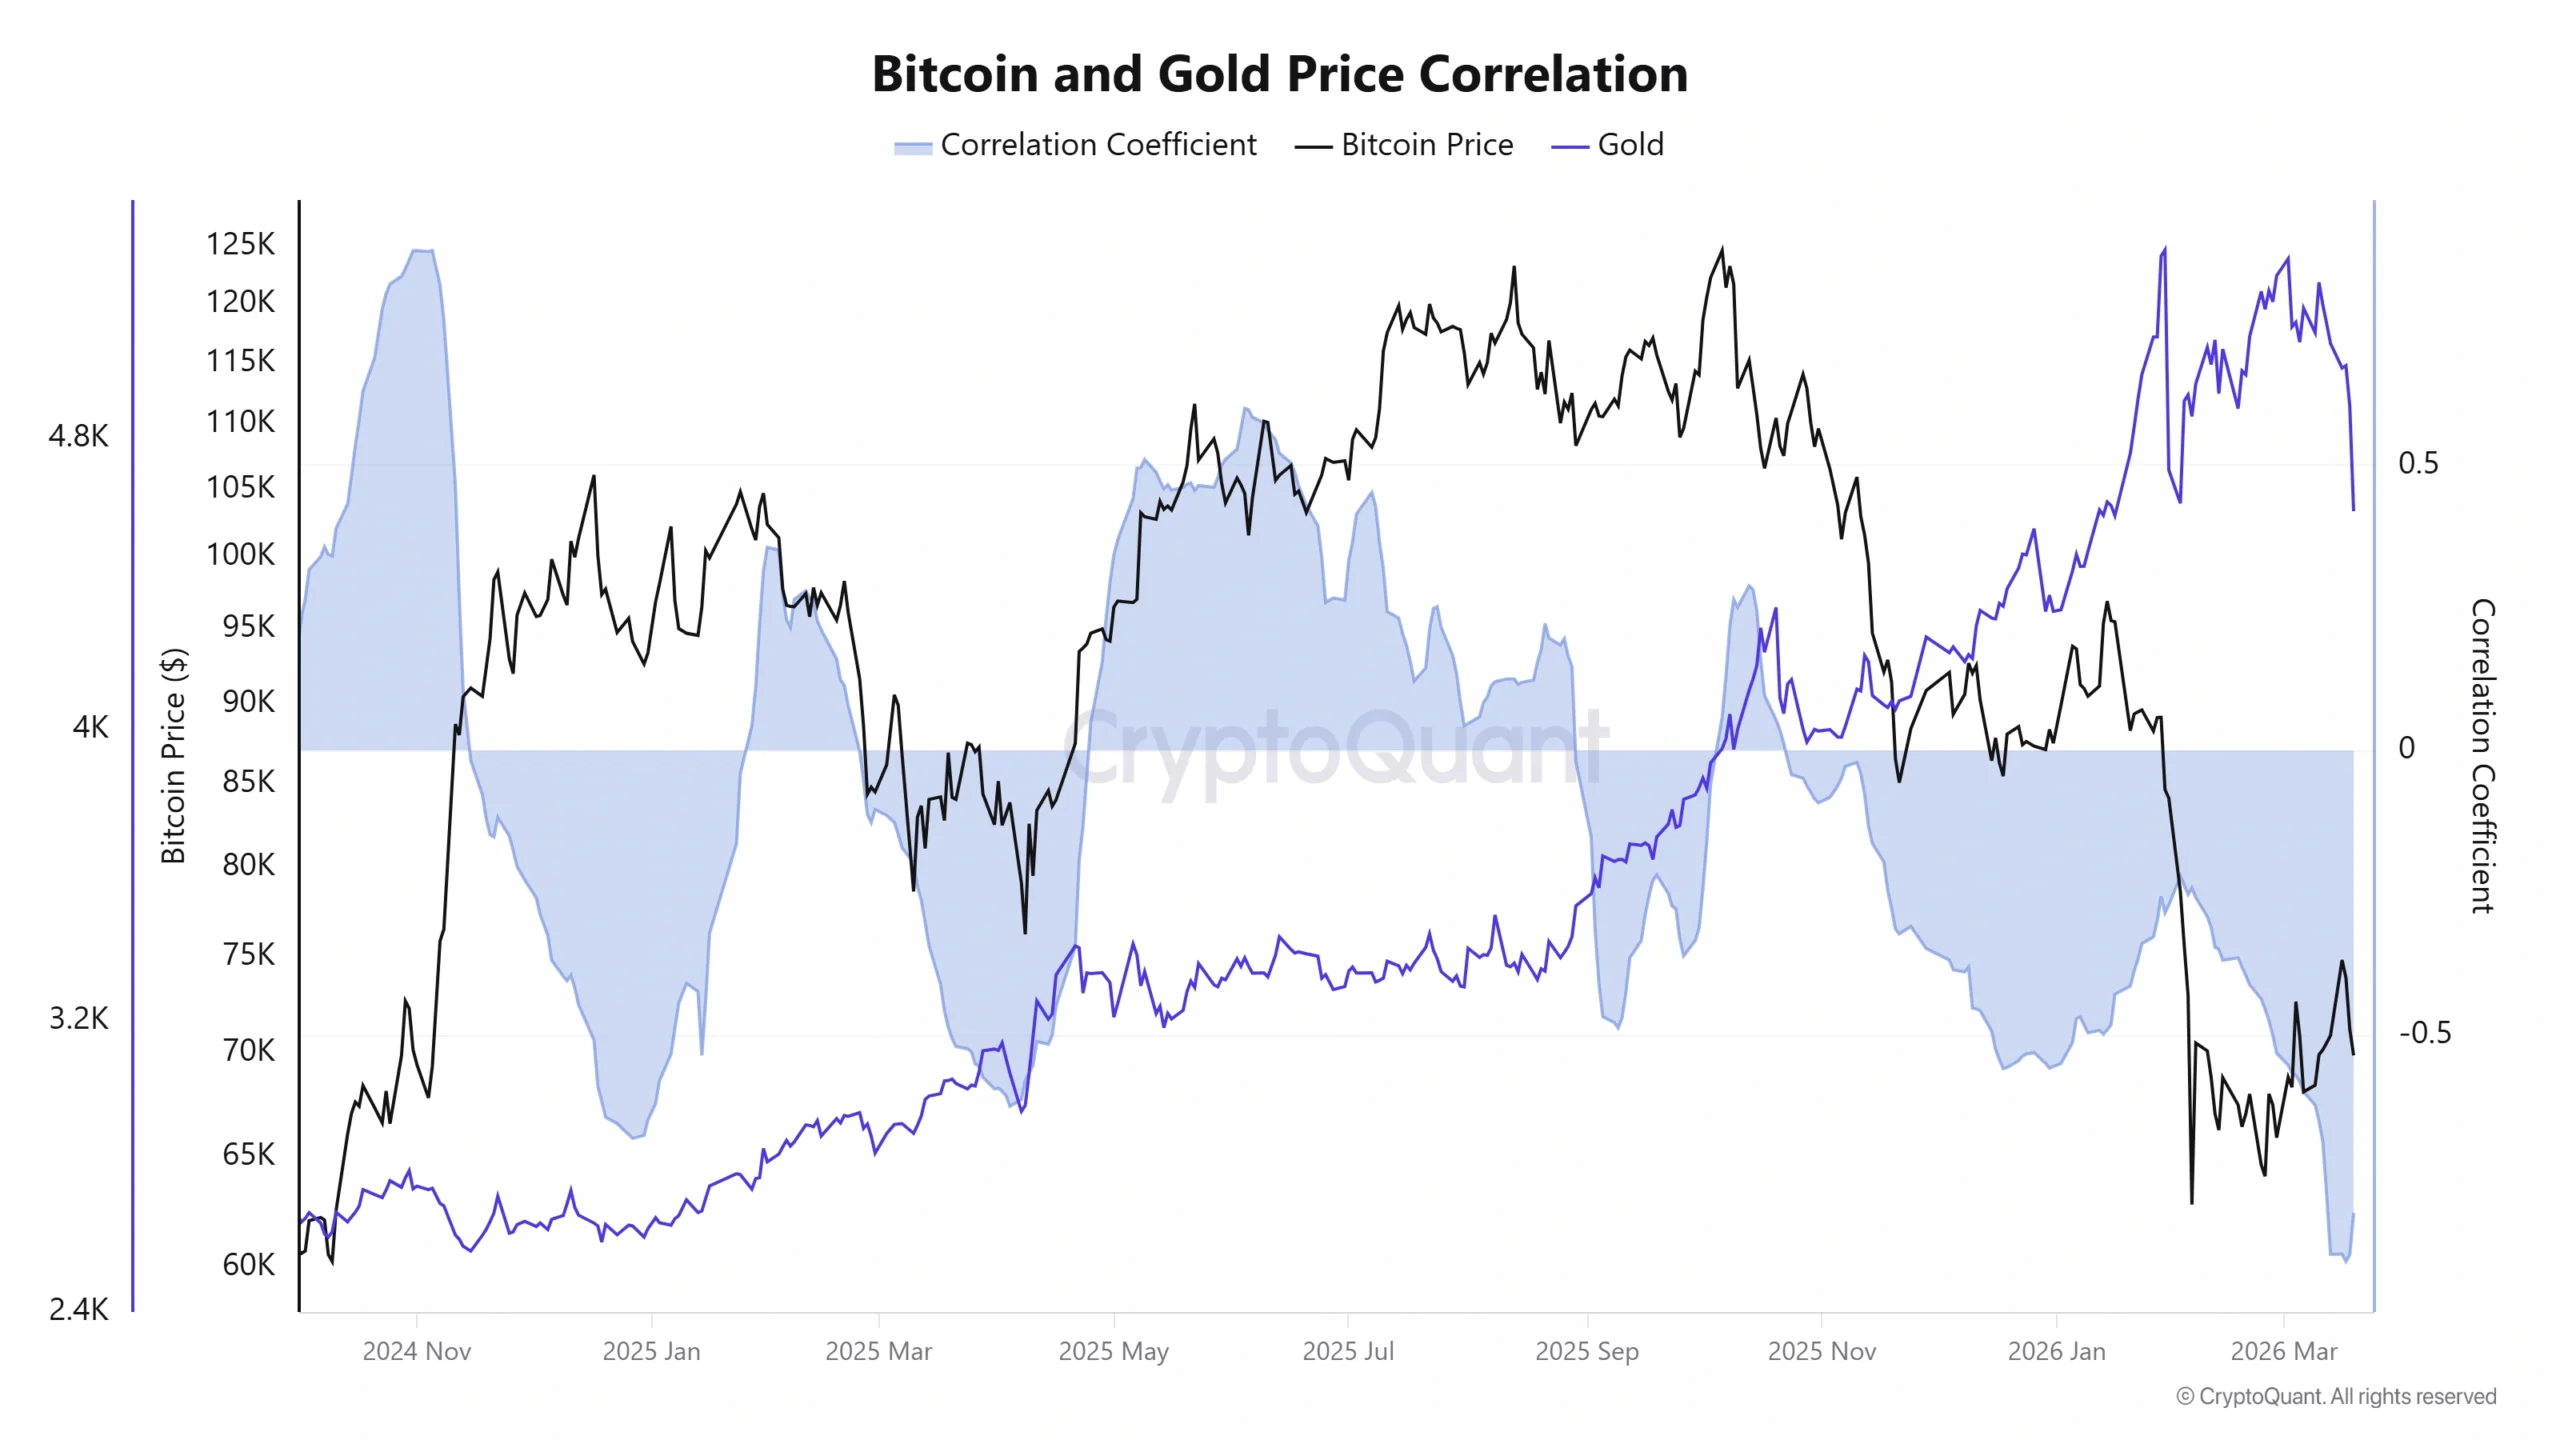
Bitcoin–Gold Correlation Hits 3-Year Low
Data from CryptoQuant helps clarify the pattern observed by van de Poppe. In March, the Bitcoin–gold correlation index dropped to -0.9, the lowest level since late 2022. At that time, Bitcoin hit a bottom at $15,600 and began a bullish trend that lasted more than two years .
Meanwhile, veteran trader Peter Brandt has pointed out that gold is forming a clear bearish pattern known as the “Nine Red Birds” pattern—nine consecutive daily closing declines. He noted that this pattern has appeared only four times in his career and often leads to markets taking years to recover .
The combination of Peter Brandt’s bearish gold outlook and Bitcoin’s historically significant inverse correlation with the yellow metal suggests that Bitcoin may have already bottomed in March .
What Drives the Divergence?
Institutional analytics firm Swissblock offered a compelling explanation for the divergence. According to their analysis, Bitcoin priced the geopolitical risk first when the Iran conflict escalated at the beginning of the month .
Bitcoin priced the geopolitical risk first.
— Swissblock (@swissblock__) March 20, 2026
When the US–Iran conflict began, $BTC dropped sharply as it absorbed the geopolitical shock over the weekend.
At that point, most would have assumed it was Bitcoin’s capitulation moment, while gold, as the classic safe haven, would… https://t.co/HwlHHw0I9Q pic.twitter.com/7spzgY8gvR
📌 Twitter Embed Description: Swissblock analyzes how Bitcoin priced geopolitical risk first, sold off sharply, but recovered fastest—demonstrating adaptation to shock rather than systemic crisis repricing.
“Bitcoin sold first, but recovered the fastest. The message is clear: Bitcoin has adapted to the shock better than expected, not repriced it as a systemic crisis,” Swissblock stated .
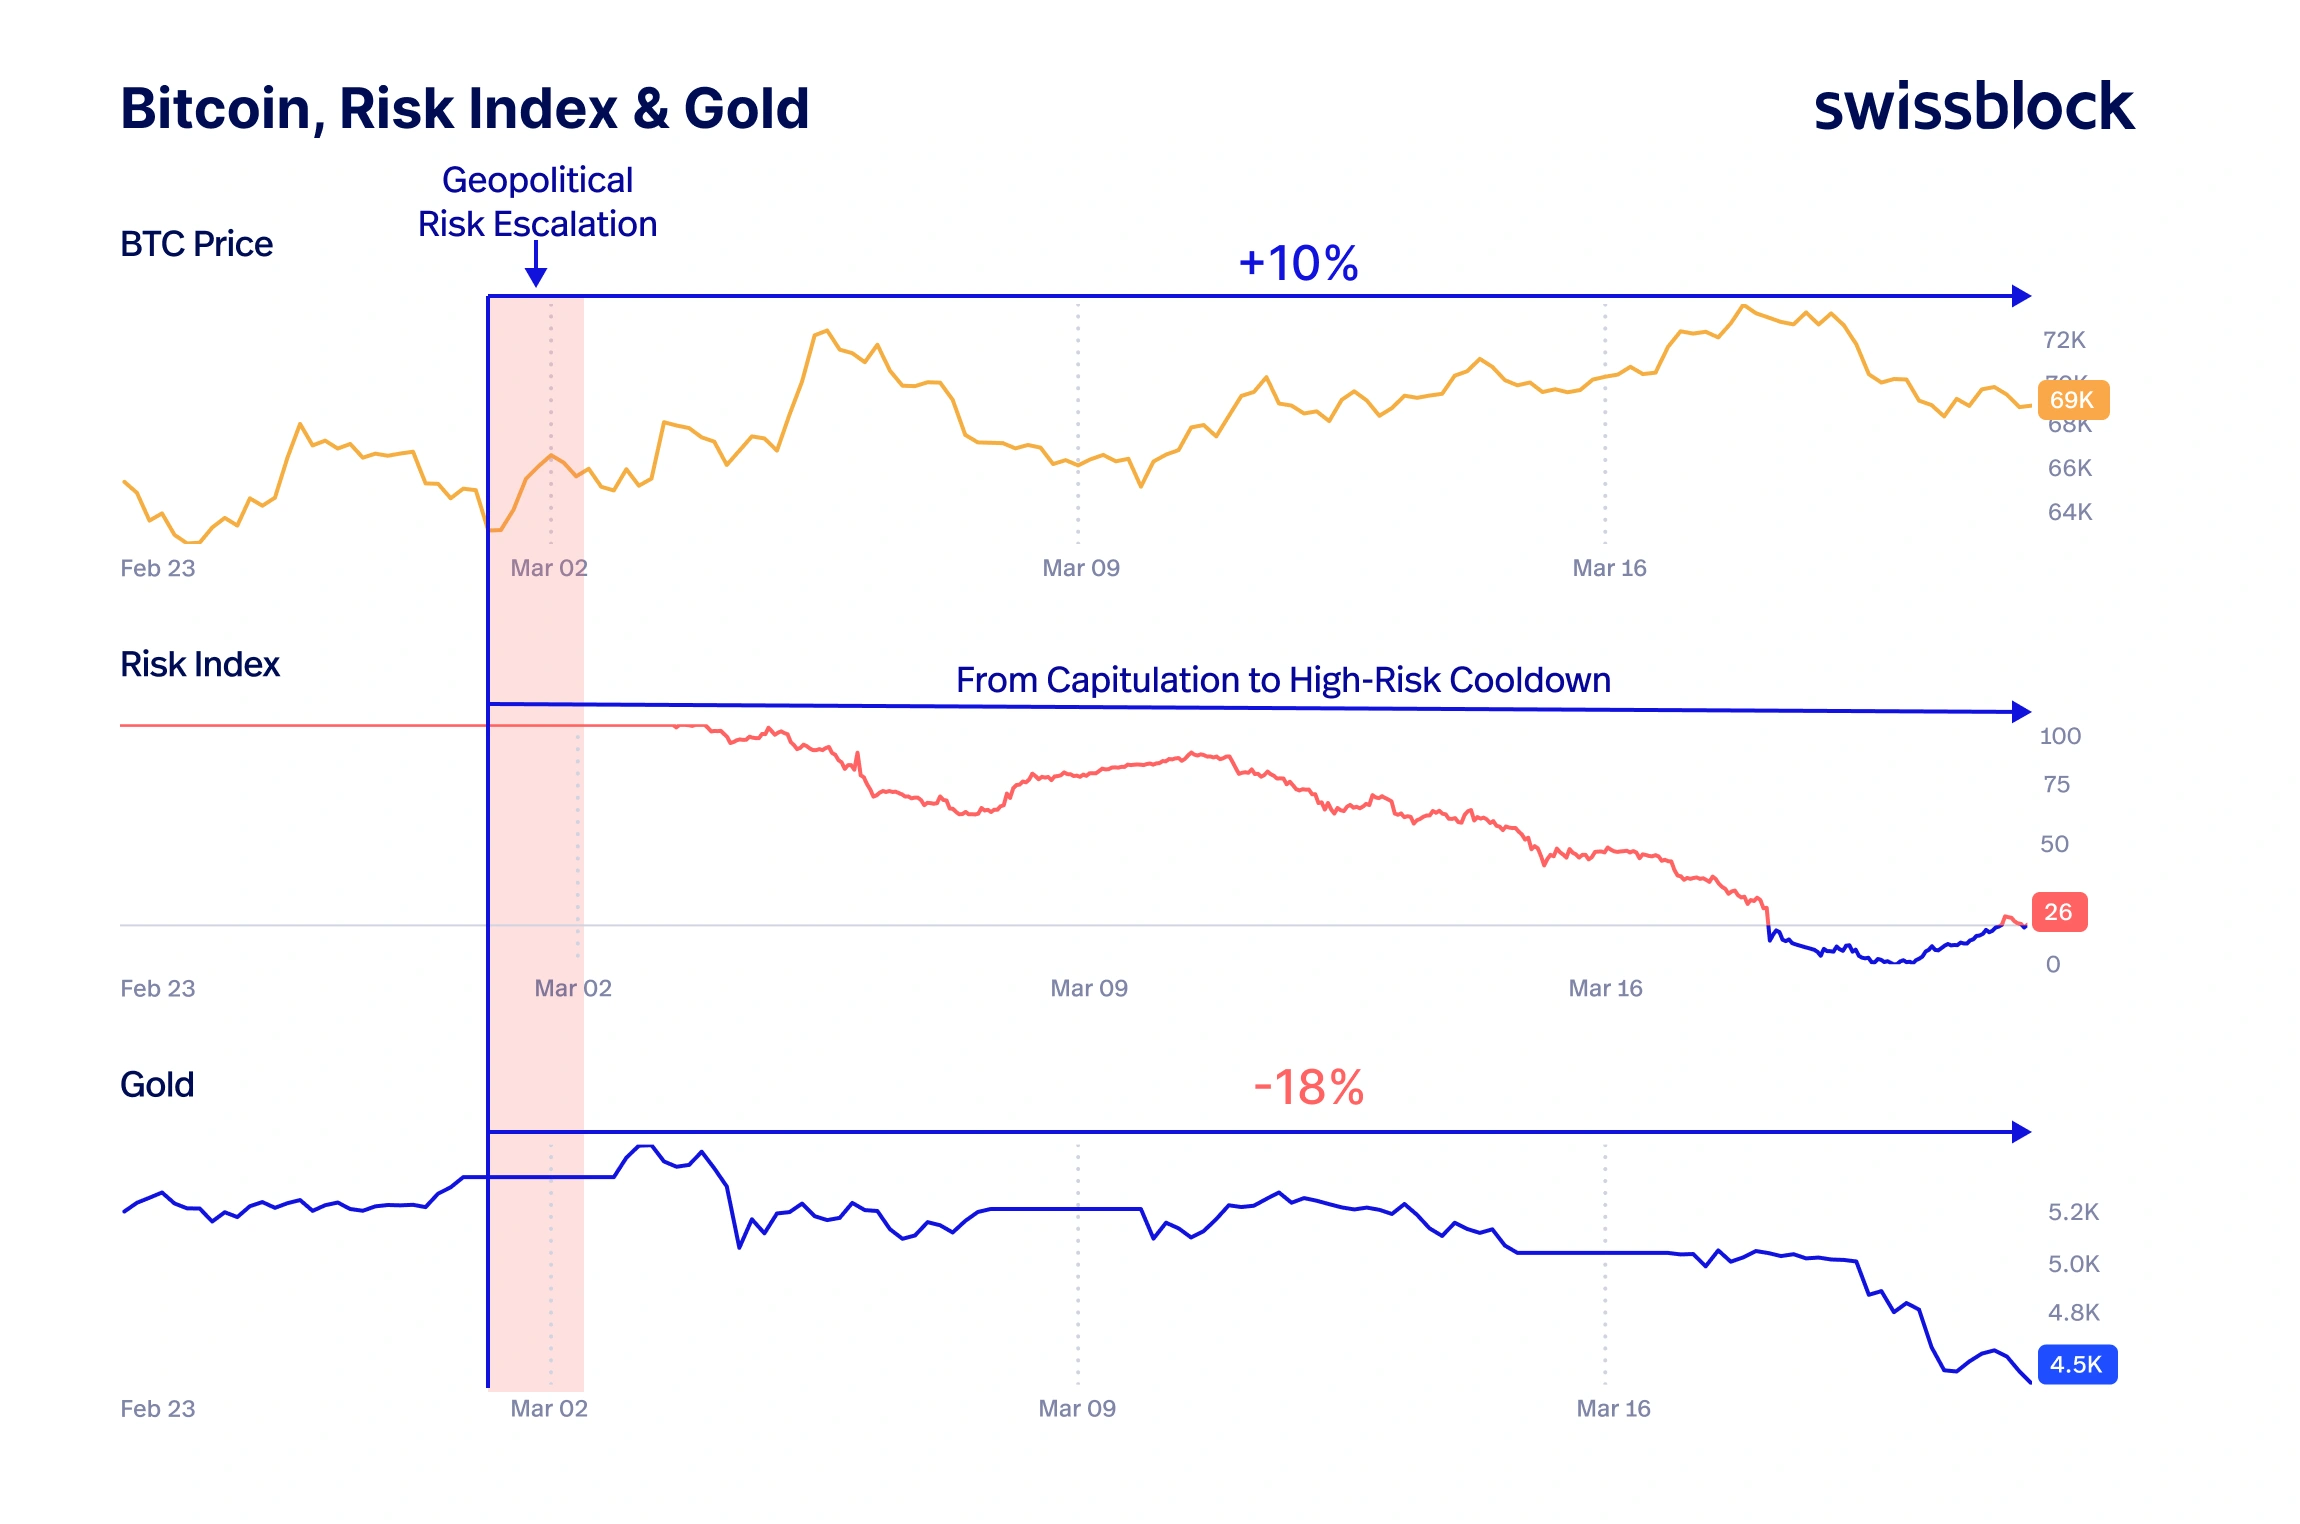
The chart from Swissblock tells a compelling story. Since the geopolitical risk escalated, Bitcoin has gained approximately 10% while gold has fallen 18%. The risk index has moved from capitulation territory to a high-risk cooldown phase, reflecting stabilization in market sentiment .
Whale Accumulation Supports the Bull Case
Adding to the positive signals, a recent report from Coin Newsweek showed that whale addresses holding more than 1,000 BTC have climbed to a one-year high despite fears of war and recession. This accumulation by large holders suggests that sophisticated investors are viewing current levels as attractive entry points .
Macro Data Ahead
Bitcoin enters the final week of March alongside key macroeconomic data releases, including PMI (Purchasing Managers’ Index) and jobless claims. These indicators may help shape market trends in the coming months. A softer economic reading could reinforce the case for a more dovish Fed, potentially benefiting risk assets like Bitcoin .
Bottom Confirmation?
The convergence of multiple signals—record-low correlation with gold, historical BTC/Gold ratio drawdown patterns, bullish divergence, and whale accumulation—suggests that Bitcoin may have already formed a bottom in March. The divergence between Bitcoin and gold, rather than signaling a flight from risk, appears to reflect a structural shift in how markets price geopolitical shocks .
As Swissblock noted, Bitcoin sold first but recovered fastest. That resilience, combined with the broader market signals, points to a market that has absorbed the shock and is now consolidating for the next move higher .
Sources: CryptoQuant, Michaël van de Poppe, Peter Brandt, Swissblock.

