

BTC Breaks $69K Then Reverses 2.30% Intraday as Resistance Holds

Bitcoin staged a brief breakout above the psychological $69,000 level on March 22, only to reverse sharply and give back all gains within hours. The intraday price action saw BTC climb to a high of approximately $69,740 before tumbling 2.30% to trade near $68,760. The rejection at higher levels underscores persistent selling pressure despite a brief surge in bullish momentum .
Multi-Timeframe Technical Analysis
The 4-hour chart from Binance reveals a classic rejection at the upper boundary of a well-defined linear regression channel. Bitcoin had been compressing within this channel since early March, with the upper band near $69,500-$69,800 acting as formidable resistance. Today’s move saw price briefly pierce this level before sellers stepped in aggressively .
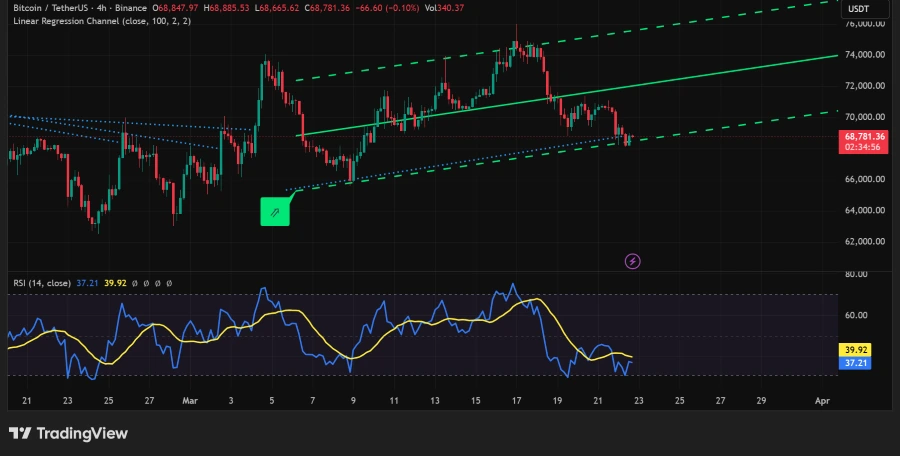
4-Hour Chart Key Observations:
– Current Price: $68,781.36
– 24-Hour Change: +0.10% (at time of chart capture)
– RSI (14): 37.21 (bearish territory, below 50)
– Volume: Moderately elevated, confirming selling pressure
– Channel Structure: Price rejected at upper band, now trading near mid-channel support
The 1-hour chart provides granular detail on the reversal. After tagging a high of $69,739.76, price collapsed nearly $1,000 in a matter of hours. The RSI on the 1-hour timeframe plunged from overbought levels (above 70) to 32.15, confirming a rapid shift from bullish to bearish momentum .
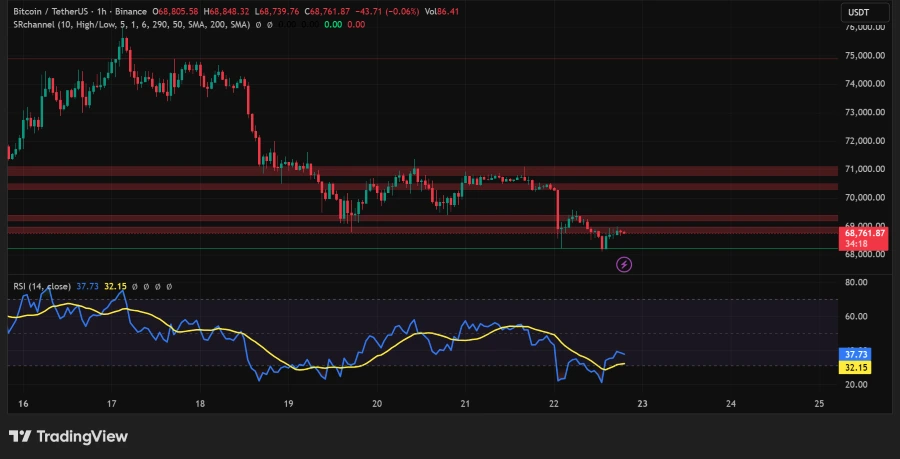
1-Hour Chart Key Observations:
– Session High: $69,739.76
– Session Low: $68,647.32 (implied from chart)
– Current Price: $68,761.87
– RSI (14): 32.15 (oversold territory)
– Volume: 86.41K with a bearish volume profile
What’s Driving the Rejection?
The rejection at $69,700 aligns with several technical and macro factors:
1. Linear Regression Channel Resistance: The 4-hour channel’s upper band has capped prices for three weeks. Each attempt to break above has been met with selling pressure, creating a well-defined resistance zone that traders are respecting .
2. RSI Divergence: On the 4-hour chart, RSI failed to confirm the price breakout. While price briefly moved higher, RSI remained below 50, signaling that bullish momentum was not strengthening—a classic bearish divergence that often precedes reversals .
3. ETF Flow Dynamics: While Bitcoin ETFs have seen four weeks of inflows, the pace of accumulation remains moderate. The lack of accelerating institutional demand may be limiting upside momentum, allowing sellers to cap rallies .
4. Macro Headwinds: Rising Treasury yields (10-year at 4.33%) and a strengthening dollar continue to weigh on risk assets. The geopolitical backdrop in the Middle East adds an additional layer of uncertainty .
5. Profit-Taking at Key Levels: The $69,000-$70,000 zone represents a significant psychological and technical barrier. Traders who accumulated positions near $68,000 likely took profits at the first sign of resistance, contributing to the swift reversal .
Key Levels to Watch
Immediate Support: $68,500-$68,600 (session lows and 4-hour mid-channel)
Major Support Zone: $67,500-$68,000 (previous consolidation area and 4-hour channel lower band)
Immediate Resistance: $69,000 (former support turned resistance) and $69,500
Major Resistance: $69,700-$70,000 (rejection zone and psychological barrier)
If Bitcoin can hold above $68,500, a retest of $69,000 is possible. However, failure to maintain this level could see prices drift toward the $67,500-$68,000 support zone, where the 4-hour channel’s lower band provides dynamic support .
Market Sentiment and Outlook
The rejection at $69,700 sends a clear signal: sellers remain active at higher levels, and the path of least resistance may be sideways to lower until a catalyst emerges. The RSI on both timeframes is now in bearish or oversold territory, suggesting that while short-term downside may be limited, any recovery will need to overcome the resistance zone that has held for weeks .
Traders will be watching for a reclaim of the $69,000 level as a sign of renewed strength. Conversely, a break below $68,000 would likely invite further selling toward $67,500. Volume and RSI dynamics will be key in determining the next directional move .
Sources: TradingView, Binance, SoSoValue, Coin Newsweek Charts.
Disclaimer: This content is for market information purposes only and is not investment advice. Cryptocurrency trading involves significant risk.

