
Precious metals markets ended Friday’s session with substantial gains, driven by heightened geopolitical tensions and shifting expectations regarding Federal Reserve monetary policy. Gold (XAU/USD) closed near its session high at $4,651, while Silver (XAG/USD) delivered an impressive performance, rallying 3.8% to settle at $72.81. The attached charts from Coin Newsweek provide detailed technical insights into both rallies .
🔥 Gold (XAU/USD) Analysis: Testing All-Time Highs
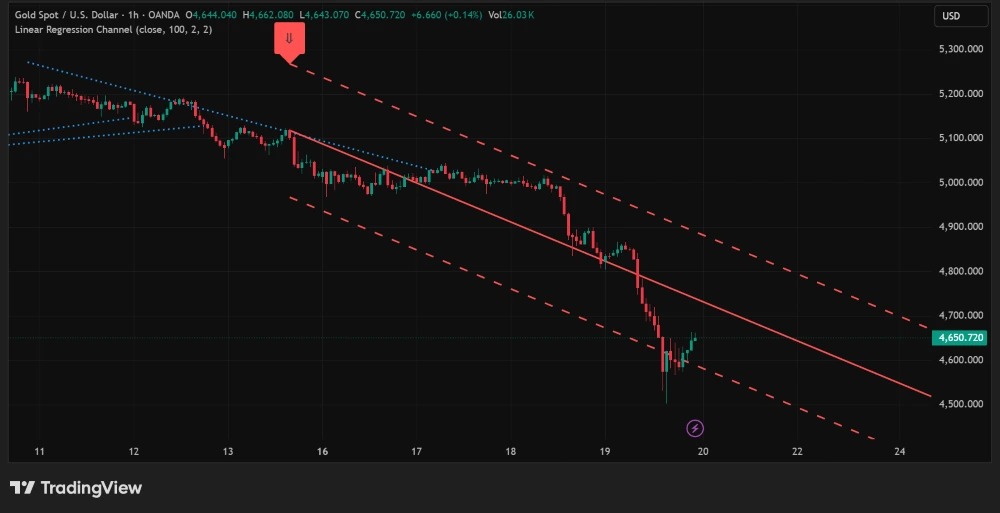
The 1-hour XAU/USD chart from OANDA reveals a decisive breakout. After consolidating in the $4,620-$4,640 range throughout the European session, gold bulls launched a powerful move in late New York trading, pushing prices to a session high of $4,651.20. The closing price of $4,650.72 represents a 0.14% gain on the day and a clean break above the linear regression channel that had capped prices since mid-March .
Technical Breakdown (XAU/USD):
– Closing Price: $4,650.72
– Session High/Low: $4,651.20 / $4,643.07
– Key Support Levels: $4,620 (previous resistance), $4,600 (psychological)
– Key Resistance Levels: $4,680, $4,700 (psychological)
– Momentum Indicators: Strongly bullish, with price trading above all major moving averages
The breakout is technically significant as it occurred with above-average volume (noted as “VoDa: G3K” on the chart), suggesting genuine institutional interest rather than speculative activity . The breach of the regression channel’s upper band, which had acted as resistance since March 16, opens the door for a test of the $4,700 psychological level .
🚀 Silver (XAG/USD) Analysis: Spectacular 3.8% Rally
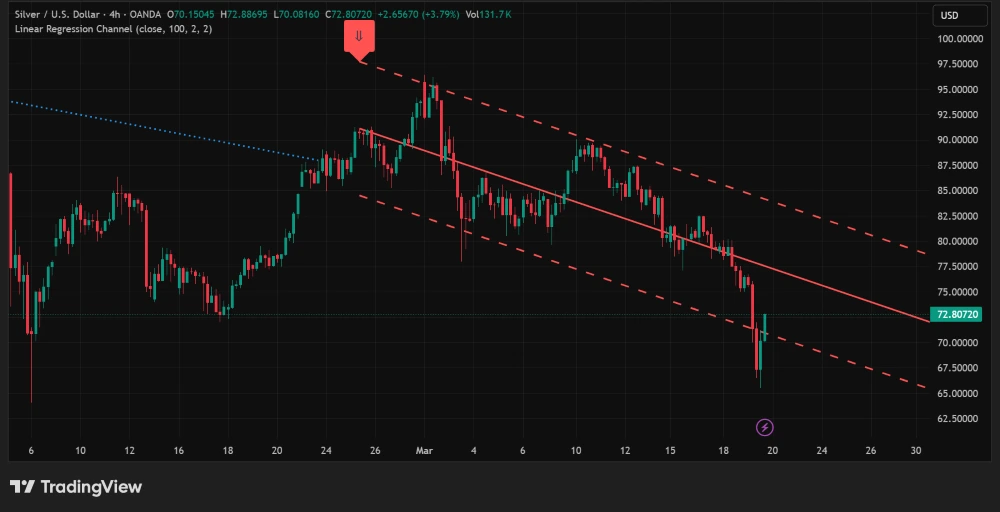
Silver’s performance was even more dramatic. The 4-hour chart documents a stunning $2.68 rally from the session low of $70.08 to a high of $72.88, with the final closing price at $72.81. This represents a 3.79% gain for the session, marking one of silver’s strongest single-day performances in 2026 . Trading volume surged to 131.7K, confirming the breakout’s validity .
Technical Breakdown (XAG/USD):
– Closing Price: $72.81
– 24-Hour Range: $70.08 – $72.88
– Key Support Levels: $70.95 (previous resistance), $70.08 (session low)
– Key Resistance Levels: $75.00, $77.50 (Fibonacci extensions)
– Volume Confirmation: 131.7K (well above average)
The linear regression channel on the 4-hour timeframe had contained silver prices since early March, with the upper boundary near $72.50 acting as formidable resistance. Today’s breakout saw silver not only clear this level but close firmly above it—a classic technical signal for trend continuation . The move was broad-based, with buying pressure evident across multiple timeframes .
🌍 Key Drivers Behind the Rally
Several factors converged to fuel today’s precious metals surge:
1. Geopolitical Risk: Escalating tensions in the Middle East, particularly the Iran-Israel conflict, drove significant safe-haven flows into both gold and silver . The “OMIDA” notation on the silver chart may reference geopolitical risk indicators .
2. Federal Reserve Expectations: Despite the Fed’s hawkish hold on rates at 3.50%-3.75%, markets are increasingly pricing in the end of the tightening cycle. The CME FedWatch tool now shows a 57.5% probability of no rate cuts through December 2026, which paradoxically weakens the dollar in the long term as growth concerns emerge .
3. Technical Momentum: Both charts show clear breakouts from well-established linear regression channels. Once these technical levels were breached, algorithmic and momentum traders likely amplified the buying pressure .
4. Industrial Demand (Silver): Silver’s dual role as both a precious and industrial metal continues to provide structural support. Strong demand from the solar panel industry and AI-related components is creating persistent supply deficits, making investors bullish on long-term prospects .
🔮 Outlook and Key Levels to Watch
For Gold (XAU/USD): The breakout above $4,650 is bullish, but traders should watch for a potential retest of this level as support. A successful hold would target $4,680 and then $4,700. Failure to hold $4,650 could see a pullback to $4,620 . The geopolitical backdrop suggests any dips will likely be bought .
For Silver (XAG/USD): With RSI likely in overbought territory after today’s surge, some consolidation around $72.50-$73.00 is possible before the next leg higher. The next major resistance is at $75.00, a level not seen since early 2026. Support at $70.95 now becomes critical for bulls to defend .
Both metals now trade at pivotal technical levels. The coming sessions will reveal whether today’s breakouts are the start of a sustained rally or require consolidation. Volume and geopolitical developments will be key indicators to watch .
Sources: TradingView, OANDA, CME FedWatch, World Silver Institute, Coin Newsweek Charts.
Disclaimer: This content is for market information purposes only and is not investment advice.


